[Round Numbers] Signal Clean Up Analysis with Backtest (TSO)Round Numbers NEW GEN indicator!
===========================================================================
===========================================================================
This is a full-cycle trading system indicator - it will show and alert each step of the trade from open to close. The algorithm here uses Round Numbers for generating signals, TP (Take Profit) and SL (Stop Loss) levels. Round numbers play big role in trading and can easily become strong support and resistance levels where price can bounce and go the opposite way or go through with a very nice run afterwards.
In addition there is a chained (NOTE: You can select several or ALL of the features, this is not limited to either one) signal cleanup and analysis approach with scheduling and alerting capabilities. Works with most popular timeframes: 1M, 3M, 5M, 15M, 30M, 1H, 4H, D.
NOTE: Every action of the trade is calculated on a confirmed closed candle bar state (barstate.isconfirmed), so the indicator will never repaint!
NOTE: At position open - there will be calculated Take-Profit and Stop-Loss targets, however each target is considered hit, when candle bar closes breaking that target, so Take-Profit and Stop-Loss when hit will slightly differ then what you see at trade/position open.
===========================================================================
===========================================================================
Round Numbers up|down unit setting and overall explanation
---------------------------------------------------------------------------
Round Number up|down unit: is the distance between round numbers on the chart. Since these round number levels are also used by the algorithm to open/close trades, it is important to set this setting to a logical number, which will correspond to an average price movement of the instrument.
Here are some examples for a few popular instruments on what will the default 1 round number unit correspond to and what would be suggested:
BTCUSD > $1 (this won't work for Bitcoin, try at least $100 - 100units)
SPY: > $1 (one of the best settings for SPY or QQQ, 50cents shows good results as well - 0.5units)
FOREX (all major pairs): > 10PIPs (that may be a bit small, unless scalping, try 50PIPs - 5units)
===========================================================================
===========================================================================
Explanation of all the Features | Strategy Configuration Guide | Indicator Settings | Signal Cleanup Analysis
---------------------------------------------------------------------------
>>> Customizable Backtesting for a specific date range, results via TradingView strategy, which includes “Deep Backtesting” for largest amounts of data on trading results.
>>> Trading Schedule with customizable trading daily time range, automatic closing/alert trades before Power Hour or right before market closes or leave it open until next day.
>>> 3 Trading Systems.
>>> Static/Dynamic/Trailing Take-Profit and Stop-Loss setups (HIGHLIGHT: Stop-Loss will be moved to Entry after TP1 is taken or a smart trailing Stop-Loss can be used with Stop-Loss dynamically following the trade to minimize risk).
>>> Single or Multiple profit targets (up to 5).
>>> Take-Profit customizable offset feature (set your Take-Profit targets slightly before everyone is expecting it!).
>>> Candle bar signal analysis (matching candle color, skip opposite structured and/or doji candle uncertain signals).
>>> Additional analysis of VWAP/EMA/ATR/EWO (Elliot Wave Oscillator)/Divergence MACD+RSI/Volume signal confirmation (clean up your chart with indicator showing only the best potential signals!).
>>> Advanced Alerts setup, which can be potentially setup with a trading bot over TradingView Webhook (NOTE: This will require advanced programming knowledge).
===========================================================================
Labels, plots, colors explanations:
---------------------------------------------------------------------------
>>>>> LONG open: green "house" looking arrow below candle bar.
>>>>> SHORT open: red "house" looking arrow above candle bar.
>>>>> LONG/SHORT take-profit target: green/red circles (multi-profit > TP2/3/4/5 smaller circles).
>>>>> LONG/SHORT stop-loss target: green/red + crosses.
>>>>> LONG/SHORT take-profit hits: green/red diamonds.
>>>>> LONG/SHORT stop-loss hits: green/red X-crosses.
>>>>> LONG/SHORT EOD (End of Day | Intraday style) close (profitable trade): green/red squares.
>>>>> LONG/SHORT EOD (End of Day | Intraday style) close (loss trade): green/red PLUS(+)-crosses.
===========================================================================
Date Range and Trading Schedule Settings
---------------------------------------------------------------------------
>>>>> Date Range: Select your start and/or end dates (uncheck “End” for indicator to show results up to the very moment and to use for LIVE trading) for backtesting results, if not using backtesting – uncheck “Start”/“End” to turn it off.
>>>>> Use TradingView “Strategy Tester” to see backtesting results
NOTE: If Strategy Tester does not show any results with Date Ranged fully unchecked, there may be an issue where a script opens a trade, but there is not enough TradingView power to set the Take-Profit and Stop-Loss and somehow an open trade gets stuck and never closes, so there are “no trades present”. In such case you will need to manually check “Start”/“End” dates or use “Depp Backtesting” feature!
>>>>> Trading Schedule: This is where you can setup Intraday Session or any custom session schedule you wish. Turn it ON. Select trading hours. Select EOD (End of Day) setting (NOTE: If it will be OFF, the indicator will assume you are holding your position open until next day!). Please note the EOD trade closure times with the 2 different Intraday close settings when turned on:
At Market Close:
1/3/5min > will close at 15:55pm ET
15min > will close at 15:45pm ET
30min > will close at 15:30pm ET
45min > will close at 15:45pm ET
60min > will close at 15:00pm ET
Before Power Hour:
1/3/5min > will close at 15:00pm ET
15min > will close at 15:00pm ET
30min > will close at 15:00pm ET
45min > will close at 15:00pm ET
60min > will close at 15:00pm ET
>>> Trading Systems: 1) "Open Until Closed by TP or SL": the signal will only open a trade if no trades are currently open/trunning, a trade can only be closed by Take Profit, Stop Loss or End of Day close (if turned on) | 2) "Open Until Closed by TP or SL + OCA": Same as 1), but if there is an opposite signal to the trade which is currently open > it will immediately be closed with new trade open or End of Day close (if turned on) | 3) "OCA (no TP or SL)": There are is Take Profit or Stop Loss, only an opposite signal will close current trade and open an opposite one or End of Day close (if turned on).
>>> Turn On/Off: Current Position SL + Opposite Position Open Signal on the same closing candle bar (If current trade hits Stop-Loss and at that same closing candle bar there is a signal for an opposite direction trade > indicator will close current position as Stop-Loss and immediately open an opposite position). NOTE: With this option turned on, there will be more trades, but not necessarily better results, since after Stop-Loss is hit, it may make sense to wait a little before opening an opposite trade, even if it matches the condition at the same time when Stop-Loss is hit, but sometimes it shows great results, so this setting/feature is included. NOTE: This setting only will work/make sense with TP and SL style/behavior both be set to "Fully Closed Candle"!
>>> Turn On/Off: Turn On/Off: Current Position REGULAR SL | Only the SL + Opposite Position Open will trigger if turned on, IF NOT - THERE WILL BE NO STOP-LOSS AT ALL!!! NOTE: It is very dangerous to trade without Stop-Loss!
>>>>> Signal Candle Bar consuming Take-Profits - position/trade signal candle bar is big enough to "consume"/close ahead the first TP setting > the signal can either be skipped, or all Take-Profit areas pushed ahead using smart formula)
>>>>> MULTIPROFIT | TP (Take-Profit) System: 1) Static – Once the trade is open, all Take-Profit target(s) are immediately calculated and set for the trade > once the target(s) is hit > trade will be partially closed (if candle bar closes beyond several Take-Profit targets > trade will be reduced accordingly to the amount of how many Take-Profit targets were hit) ||| 2) Dynamic – Once the trade is open, only the 1st Take-Profit target is calculated, once the 1st Take-Profit is hit > next Take-Profit distance is calculated based on the distance from trade Entry to where 1st Take-Profit was taken, once 2nd Take-Profit is taken > 3rd Take-Profit is calculated per same logic, these are good for price momentum as with price speeding up – profits increase as well!
>>>>> MULTIPROFIT: SL (stop loss) System | Static: SL is set at position open and remains such; Dynamic: Once ANY TP is taken > SL will be moved to Entry; Trailing: SL will be moved along the position (smart trailing stop-loss), at TP1 taken > SL moves to Entry, at TP2 taken > SL moves to TP1, at TP3 taken > SL moves to TP2 and so on.
>>>>> # of TPs (number of take profit targets): Just like it is named, this is where you select the number of Take-Profit targets for your trading system (NOTE: If "OCA (no TP or SL)" Trading System is selected, this setting won’t do anything, since there are no TP or SLs for that system).
>>>>> TP(s) offset: This is a special feature for all Take-Profit targets, where you can turn on a customizable offset, so that if the price is almost hitting the Take-Profit target, but never actually touches it > you will capture it. This is good to use with HHLL (Highest High Lowest Low), which is pretty much a Support/Resistance as often the price will nearly touch these strong areas and turn around…
===========================================================================
Dynamic/Static/Trailing Take-Profit and Stop-Loss visual examples:
---------------------------------------------------------------------------
1) Fully Static Take-Profit and Stop-Loss
This one is a fully static setup for both Take-Profit and Stop-Loss, you can also observe how trade is closed right before the Power Hour (trade can be closed right before Power Hour or right before Market Closes or left overnight as desired).
2) Static/Dynamic, Static Take-Profit and Dynamic Stop-Loss
You can see a static Take-Profit set at position open, while Stop-Loss moves to Entry once TP1 target is taken.
3) Static/Trailing, Static Take-Profit and Trailing Stop-Loss
In here with each Take-Profit taken, Stop-Loss moves along the trade to previous Take-Profit level, you can notice how stop-loss literally follows the trade and reduces the potential loss.
4) Dynamic/Trailing, Dynamic Take-Profit and Trailing Stop-Loss
See how Take-Profit distances increase with price momentum. Just like in previous example - Trailing Stop-Loss is following the trade and reducing the riks.
===========================================================================
Signal Analysis and Cleanup Settings
---------------------------------------------------------------------------
>>>>> Candle Analysis | Candle Color signal confirmation: If closed candle bar color does not match the signal direction > no trade will be open.
>>>>> Candle Analysis | Skip opposite candle signals: If closed candle bar color will match the signal direction, but candle structure will be opposite (for example: bearish green hammer, long high stick on top of a small green square) > no trade will be open.
>>>>> Candle Analysis | Skip doji candle signals: If closed candle bar will be the uncertain doji > no trade will be open.
>>>>> Divergence/Oscillator Analysis | EWO (Elliot Wave Oscillator) signal confirmation: LONG will only be open if at signal, EWO is green or will be at bullish slope (you can select which setting you desire), SHORT if EWO is red or will be at bearish slope.
>>>>> Divergence/Oscillator Analysis | VWAP signal confirmation: LONG will only be open if at signal, the price will be above VWAP, SHORT if below.
>>>>> Divergence/Oscillator Analysis | Moving Average signal confirmation: LONG will only be open if at signal, the price will be above selected Moving Average, SHORT if below.
>>>>> Divergence/Oscillator Analysis | ATR signal confirmation: LONG will only be open if at signal, the price will be above ATR, SHORT if below.
>>>>> Divergence/Oscillator Analysis | RSI + MACD signal confirmation: LONG will only be open if at signal, RSI + MACD will be bullish, SHORT if RSI + MACD will be bearish.
>>>>> Volume signal confirmation: LONG/SHORT will only be opened with strong Volume matching the signal direction, by default, strong Volume percentage is set to 150% and weak to 50%, but you can change it as you desire.
===========================================================================
||||||||||||||||||||||||||||||||||| *** ||||||||||||||||||||||||||||||||||| *** |||||||||||||||||||||||||||||||||||
||||||||||||||||||||||||||||||||||| *** ||||||||||||||||||||||||||||||||||| *** |||||||||||||||||||||||||||||||||||
TP System - VERY IMPORTANT INFO!
-------------------------------------------------------------------------------------------------------------------
"TP PERCENTAGE" - amount by which current trade/position needs to be reduced/partially closed/sold.
-------------------------------------------------------------------------------------------------------------------
TP System: Dynamic
"TP PERCENTAGE" - will always be the same amount (trade/position size divided by the # of take-profit(TP) targets) and percentage to be closed will always be of the ORIGINAL trade/position.
-------------------------------------------------------------------------------------------------------------------
TP System: Static
"TP PERCENTAGE" - will always be the same amount IF take-profit(TP) targets are hit 1-by-1 (TP1 > TP2 > TP3 > TP4 > TP5), otherwise it will vary and unless it is a 1st take-profit(TP1), the REMAINING trade/position size will always be smaller than original and therefore the percentage to be closed will always be of the REMAINING trade/position and NOT the original one!
-------------------------------------------------------------------------------------------------------------------
"TP PERCENTAGE" CheatSheet (these are the only percentages you may see)
-----------------------------------------------------------------------
TP PERCENTAGE---Close/Sell Amount-------------Example (trade size: 50 stocks)
20%-------------trade size * 0.2--------------50 * 0.2 = 10 stocks
25%-------------trade size * 0.25-------------50 * 0.25 = 12.5(~13) stocks
34%-------------trade size * 0.34-------------50 * 0.34 = 17 stocks
40%-------------trade size * 0.4--------------50 * 0.4 = 20 stocks
50%-------------trade size * 0.5--------------50 * 0.5 = 25 stocks
60%-------------trade size * 0.6--------------50 * 0.6 = 30 stocks
66%-------------trade size * 0.66-------------50 * 0.66 = 33 stocks
75%-------------trade size * 0.75-------------50 * 0.75 = 37.5(~38) stocks
80%-------------trade size * 0.8--------------50 * 0.8 = 40 stocks
100%------------trade size--------------------50 = 50 stocks
-----------------------------------------------------------------------
If for any reason a portion of the current/remaining trade closed at such occurrence was slightly wrong, it is not an issue. Such occurrences are rare and with slight difference in partial TP closed is not significant to overall performance of our algorithms.
||||||||||||||||||||||||||||||||||| *** ||||||||||||||||||||||||||||||||||| *** |||||||||||||||||||||||||||||||||||
||||||||||||||||||||||||||||||||||| *** ||||||||||||||||||||||||||||||||||| *** |||||||||||||||||||||||||||||||||||
Alert Settings (you don’t have to touch this section unless you will be using TradingView alerts through a Webhook to use with trading bot)
---------------------------------------------------------------------------
Here is how a LONG OPEN alert looks like.
NOTE: Each label , , etc. is customizable, you can change the text of it within indicator Input settings.
ALERT >>>>>>>>>>>>>>>>>>>>>>>>>>>>>>>>>>>>>>>>>>>>>>>
COIN: BTCUSD
TIMEFRAME: 15M
LONG: OPEN
ENTRY: 20000
TP1: 20500
TP2: 21000
TP3: 21500
TP4: 22500
TP5: 23500
SL: 19000
Leverage: 0
---------------------------------------------------------------------------
Here is how a TP1 alert will look with 5 TPs breakdown of the trade.
NOTE1: Next to TP1 taken it will show at which price it was triggered.
NOTE2: Next to "TP Percentage" it shows how much of the CURRENT/ACTIVE/REMAINING trade needs to be closed.
NOTE2: If TP2/3/4/5 comes before TP1 - the alert will tell you exactly how many percent of the trade needs to be closed!
ALERT >>>>>>>>>>>>>>>>>>>>>>>>>>>>>>>>>>>>>>>>>>>>>>>
COIN: BTCUSD
TIMEFRAME: 15M
LONG: TP1
TP1: 20500
TP Percentage: 20%
---------------------------------------------------------------------------
Here is how an alert will look for LONG - STOP-LOSS.
ALERT >>>>>>>>>>>>>>>>>>>>>>>>>>>>>>>>>>>>>>>>>>>>>>>
COIN: BTCUSD
TIMEFRAME: 15M
ENTRY: 20000
LONG: SL
SL: 19000
---------------------------------------------------------------------------
Here is how an alert will look for LONG - EOD (End of Day) In Profit close.
ALERT >>>>>>>>>>>>>>>>>>>>>>>>>>>>>>>>>>>>>>>>>>>>>>>
COIN: BTCUSD
TIMEFRAME: 15M
LONG: EOD-Close (profit)
ENTRY: 20000
EOD-Close: 21900
===========================================================================
Adding Alerts in TradngView
---------------------------------------------------------------------------
-Add indicator to chart and make sure the correct strategy is configured (check Backtesting results)
-Right-click anywhere on the TradingView chart
-Click on Add alert
-Condition: Select this indicator by it’s name
-Immediately below, change it to "alert() function calls only", as other wise there will be 2 alerts for every alert!
-Expiration: Open-ended (that may require higher tier TradingView account, otherwise the alert will need to be occasionally re-triggered)
-Alert name: Whatever you desire
-Hit “Create”
-Note: If you change ANY Settings within the indicator – you must DELETE the current alert and create a new one per steps above, otherwise it will continue triggering alerts per old Settings!
===========================================================================
If you have any questions or issues with the indicator, please message me directly via TradingView.
---------------------------------------------------------------------------
Good Luck! (NOTE: Trading is very risky, past performance is not necessarily indicative of future results, so please trade responsibly!)
---------------------------------------------------------------------------
NOTE: There seems to be a strange glitch when strategy is running live, it will show "double-take" take-profits labels on the chart. This is not affecting the script logic and backtesting results, if you simply change the timeframe real quick to something else then back - it will no longer show the duplicate orders... this must be some sort of a glitch as every alert was thoroughly tested to make sure everything is working!
"stop loss" için komut dosyalarını ara

Risk Management and Positionsize - MACD exampleMastering Risk Management
Risk management is the cornerstone of successful trading, and it's often the difference between turning a profit and suffering a loss. In light of its importance, I share a risk management tool which you can use for your trading strategies. The script not only assists in position sizing but also comes with built-in technical features that help in market timing. Let's delve into the nitty-gritty details.
Input Parameter: MarginFactor
One of the key features of the script is the MarginFactor input parameter. This element lets you control the portion of your equity used for placing each trade. A MarginFactor of -0.5 means 50% of your total equity will be deployed in placing the position size. Although Tradingview has a built-in option to adjust position sizing in a same way, I personally prefer to have the logic in my pinecode script. The main reason is userexperience in managing and testing different settings for different charts, timeframes and instruments (with the same strategy).
Stoploss and MarginFactor
If your strategy has a 4% stop-loss, you can choose to use only 50% of your equity by setting the MarginFactor to -0.5. In this case, you are effectively risking only 2% of your total capital per trade, which aligns well with the widely-accepted rule of thumb suggesting a 1-2% risk per trade. Similar if your stoploss is only 1% you can choose to change the MarginFactor to 1, resulting in a positionsize of 200% of your equity. The total risk would be again 2% per trade if your stoploss is set to 1%.
Max Drawdown and MarginFactor
Your MarginFactor setting can also be aligned with the maximum drawdown of your strategy, seen during a backtested period of 2-3 years. For example, if the max drawdown is 15%, you could calibrate your MarginFactor accordingly to limit your risk exposure.
Option to Toggle Number of Contracts
The script offers the option to toggle between using a percentage of equity for position sizing or specifying a fixed number of contracts. Utilizing a percentage of equity might yield unrealistic backtest results, especially over longer periods. This occurs because as the capital grows, the absolute position size also increases, potentially inflating the accumulated returns generated by the backtester. On the other hand, setting a fixed number of contracts as your position size offers a more stable and realistic ROI over the backtested period, as it removes the compounding effect on position sizes.
Key Features Strategy
MACD High Time Frame Entry and Exit Logic
The strategy employs a high time frame MACD (Moving Average Convergence Divergence) to make entry and exit decisions. You can easily adjust the timeframe settings and MACD settings in the inputsection to trade on lower timeframes. For more information on the HTF MACD with dynamic smoothing see:
Moving Average High Time Frame Filter
To reduce market 'noise', the strategy incorporates a high time frame moving average filter. This ensures that the trades are aligned with the dominant market trend (trading the trend). In the inputsection traders can easily switch between different type of moving averages. For more information about this HTF filter see:
Dynamic Smoothing
The script includes a feature for dynamic smoothing. The script contains The timeframeToMinutes(tf) function to convert any given time frame into its equivalent in minutes. For example, a daily (D) time frame is converted into 1440 minutes, a weekly (W) into 10,080 minutes, and so forth. Next the smoothing factor is calculated by dividing the minutes of the higher time frame by those of the current time frame. Finally, the script applies a Simple Moving Average (SMA) over the MACD, SIGNAL, and HIST values, MA filter using the dynamically calculated smoothing factor.
User Convenience: One of the major benefits is that traders don't need to manually adjust the smoothing factor when switching between different time frames. The script does this dynamically.
Visual Consistency: Dynamic smoothing helps traders to more accurately visualize and interpret HTF indicators when trading on lower time frames.
Time Frame Restriction: It's crucial to note that the operational time frame should always be lower than the time frame selected in the input sections for dynamic smoothing to function as intended.
By incorporating this dynamic smoothing logic, the script offers traders a nuanced yet straightforward way to adapt High Time Frame indicators for lower time frame trading, enhancing both adaptability and user experience.
Limitations: Exit Strategy
It's crucial to note that the script comes with a simplified exit strategy, devoid of features like a stop-loss, trailing stop-loss or multiple take profits. This means that while the script focuses on entries and risk management, it might result in higher losses if market conditions unexpectedly turn unfavorable.
Conclusion
Effective risk management is pivotal for trading success, and this TradingView script is designed to give you a better idea how to implement positions sizing with your preferred strategy. However, it's essential to note that this tool should not be considered financial advice. Always perform your due diligence and consult with financial advisors before making any trading decisions.
Feel free to use this risk management tool as building block in your trading scripts, Happy Trading!

Elliott Wave with Supertrend Exit - Strategy [presentTrading]## Introduction and How it is Different
The Elliott Wave with Supertrend Exit provides automated detection and validation of Elliott Wave patterns for algorithmic trading. It is designed to objectively identify high-probability wave formations and signal entries based on confirmed impulsive and corrective patterns.
* The Elliott part is mostly referenced from Elliott Wave by @LuxAlgo
Key advantages compared to discretionary Elliott Wave analysis:
- Wave Labeling and Counting: The strategy programmatically identifies swing pivot highs/lows with the Zigzag indicator and analyzes the waves between them. It labels the potential impulsive and corrective patterns as they form. This removes the subjectivity of manual wave counting.
- Pattern Validation: A rules-based engine confirms valid impulsive and corrective patterns by checking relative size relationships and fib ratios. Only confirmed wave counts are plotted and traded.
- Objective Entry Signals: Trades are entered systematically on the start of new impulsive waves in the direction of the trend. Pattern failures invalidate setups and stop out positions.
- Automated Trade Management: The strategy defines specific rules for profit targets at fib extensions, trailing stops at swing points, and exits on Supertrend reversals. This automates the entire trade lifecycle.
- Adaptability: The waveform recognition engine can be tuned by adjusting parameters like Zigzag depth and Supertrend settings. It adapts to evolving market conditions.
ETH 1hr chart
In summary, the strategy brings automation, objectivity and adaptability to Elliott Wave trading - removing subjective interpretation errors and emotional trading biases. It implements a rules-based, algorithmic approach for systematically trading Elliott Wave patterns across markets and timeframes.
## Trading Logic and Rules
The strategy follows specific trading rules based on the detected and validated Elliott Wave patterns.
Entry Rules
- Long entry when a new impulsive bullish (5-wave) pattern forms
- Short entry when a new impulsive bearish (5-wave) pattern forms
The key is entering on the start of a new potential trend wave rather than chasing.
Exit Rules
- Invalidation of wave pattern stops out the trade
- Close long trades on Supertrend downturn
- Close short trades on Supertrend upturn
- Use a stop loss of 10% of entry price (configurable)
Trade Management
- Scale out partial profits at Fibonacci levels
- Move stop to breakeven when price reaches 1.618 extension
- Trail stops below key swing points
- Target exits at next Fibonacci projection level
Risk Management
- Use stop losses on all trades
- Trade only highest probability setups
- Size positions according to chart timeframe
- Avoid overtrading when no clear patterns emerge
## Strategy - How it Works
The core logic follows these steps:
1. Find swing highs/lows with Zigzag indicator
2. Analyze pivot points to detect impulsive 5-wave patterns:
- Waves 1, 3, and 5 should not overlap
- Waves 3 and 5 must be longer than wave 1
- Confirm relative size relationships between waves
3. Validate corrective 3-wave patterns:
- Look for overlapping, choppy waves that retrace the prior impulsive wave
4. Plot validated waves and Fibonacci retracement levels
5. Signal entries when a new impulsive wave pattern forms
6. Manage exits based on pattern failures and Supertrend reversals
Impulsive Wave Validation
The strategy checks relative size relationships to confirm valid impulsive waves.
For uptrends, it ensures:
```
Copy code- Wave 3 is longer than wave 1
- Wave 5 is longer than wave 2
- Waves do not overlap
```
Corrective Wave Validation
The strategy identifies overlapping corrective patterns that retrace the prior impulsive wave within Fibonacci levels.
Pattern Failure Invalidation
If waves fail validation tests, the strategy invalidates the pattern and stops signaling trades.
## Trade Direction
The strategy detects impulsive and corrective patterns in both uptrends and downtrends. Entries are signaled in the direction of the validated wave pattern.
## Usage
- Use on charts showing clear Elliott Wave patterns
- Start with daily or weekly timeframes to gauge overall trend
- Optimize Zigzag and Supertrend settings as needed
- Consider combining with other indicators for confirmation
## Default Settings
- Zigzag Length: 4 bars
- Supertrend Length: 10 bars
- Supertrend Multiplier: 3
- Stop Loss: 10% of entry price
- Trading Direction: Both

[Volume Profile] Signal Clean Up Analysis with Backtest (TSO) This is a full-cycle trading system indicator, which uses Volume Profile for generating signals using a custom developed algorithm, TP (Take Profit) and SL (Stop Loss) levels. There are 2 SOURCES for signals (each can be used separately or both can be used at the same time, each signal SOURCE is using Volume Profile levels to open optimal trade direction) with chained (NOTE: You can select several or ALL of the features, this is not limited to either one) signal cleanup and analysis approach with scheduling and alerting capabilities. Works with most popular timeframes: 1M, 5M, 15M, 1H, 4H, D, great for intraday trading!
NOTE: Every calculation is done on a confirmed closed candle bar state, so the indicator will never repaint!
===========================================================================
Explanation of all the Features | Configuration Guide | Indicator Settings | Signal Cleanup Analysis
---------------------------------------------------------------------------
>>> Customizable Backtesting for a specific date range, results via TradingView strategy, which includes “Deep Backtesting” for largest amounts of data on trading results.
>>> Trading Schedule with customizable trading daily time range, automatic closing/alert trades before Power Hour or right before market closes or leave it open until next day.
>>> 3 Trading Systems.
>>> Multiple Signal SOURCEs for opening trades, either SOURCE can be used or both at the same time!
>>> Static/Dynamic Stop-Loss setups (HIGHLIGHT: Stop-Loss will be moved to Entry after TP1 is taken, which minimizes risk).
>>> Single or Multiple profit targets (up to 3).
>>> Take-Profit customizable offset feature (set your Take-Profit targets slightly before everyone is expecting it!).
>>> Candle bar signal analysis (matching candle color, skip opposite structured and/or doji candle uncertain signals).
>>> Additional analysis of VWAP/EMA/ATR/EWO (Elliot Wave Oscillator)/Divergence MACD+RSI/Volume signal confirmation (clean up your chart with indicator showing only the best potential signals!).
>>> Advanced Alerts setup, which can be potentially setup with a trading bot over TradingView Webhook (NOTE: This will require advanced programming knowledge).
===========================================================================
Labels, plots, colors explanations:
---------------------------------------------------------------------------
>>>>> Signal SOURCE(s): Green/Red arrows, which will be shown unconditionally, outside of trade engine and can be hidden if desired.
>>>>> LONG open: green "house" looking arrow below candle bar.
>>>>> SHORT open: red "house" looking arrow above candle bar.
>>>>> LONG/SHORT take-profit target: green/red circles (multi-profit > TP2/3/4/5 smaller circles).
>>>>> LONG/SHORT take-profit hits: green/red diamonds.
>>>>> LONG/SHORT stop-loss target: green/red + crosses.
>>>>> LONG/SHORT stop-loss hits: green/red X-crosses.
>>>>> LONG/SHORT EOD close (profitable trade): green/red squares.
>>>>> LONG/SHORT EOD close (loss trade): green/red PLUS(+)-crosses.
===========================================================================
Date Range and Trading Schedule Settings
---------------------------------------------------------------------------
>>>>> Date Range: Select your start and/or end dates (uncheck “End” for indicator to show results up to the very moment and to use for LIVE trading) for backtesting results, if not using backtesting – uncheck “Start”/“End” to turn it off.
>>>>> Use TradingView “Strategy Tester” to see backtesting results
NOTE: If Strategy Tester does not show any results with Date Ranged fully unchecked, there may be an issue where a script opens a trade, but there is not enough TradingView power to set the Take-Profit and Stop-Loss and somehow an open trade gets stuck and never closes, so there are “no trades present”. In such case you will need to manually check “Start”/“End” dates or use “Depp Backtesting” feature!
>>>>> Trading Schedule: This is where you can setup Intraday Session or any custom session schedule you wish. Turn it ON. Select trading hours. Select EOD (End of Day) setting (NOTE: If it will be OFF, the indicator will assume you are holding your position open until next day!).
>>> Trading Systems: 1) "Open Until Closed by TP or SL": the signal will only open a trade if no trades are currently open/trunning, a trade can only be closed by Take Profit, Stop Loss or End of Day close (if turned on) | 2) "Open Until Closed by TP or SL + OCA": Same as 1), but if there is an opposite signal to the trade which is currently open > it will immediately be closed with new trade open or End of Day close (if turned on) | 3) "OCA (no TP or SL)": There are is Take Profit or Stop Loss, only an opposite signal will close current trade and open an opposite one or End of Day close (if turned on)
>>>>> MULTIPROFIT | TP (Take-Profit) System: Once the trade is open, all Take-Profit target(s) are immediately calculated and set for the trade > once the target(s) is hit > trade will be partially closed (if candle bar closes beyond several Take-Profit targets > trade will be reduced accordingly to the amount of how many Take-Profit targets were hit)
>>>>> MULTIPROFIT | SL (Stop-Loss) System: 1) Static – Once the trade is open, Stop-Loss is calculated and set for the remaining of the trade ||| 2) Dynamic – At trade open, Stop-Loss is calculated and set the same way, however once 1st Take-Profit is taken > Stop-Loss is moved to Entry, reducing the risk.
>>>>> # of TPs (number of take profit targets): Just like it is named, this is where you select the number of Take-Profit targets for your trading system (NOTE: If "OCA (no TP or SL)" Trading System is selected, this setting won’t do anything, since there are no TP or SLs for that system).
>>>>> TP(s) offset: This is a special feature for all Take-Profit targets, where you can turn on a customizable offset, so that if the price is almost hitting the Take-Profit target, but never actually touches it > you will capture it. This is good to use with HHLL (Highest High Lowest Low), which is pretty much a Support/Resistance as often the price will nearly touch these strong areas and turn around…
===========================================================================
Take-Profit and Stop-Loss visual example:
---------------------------------------------------------------------------
1) A simply nice intraday trading day for SPY (S&P500 ETF TRUST) with a single Take-Profit target on each trade.
See how Take-Profit distances increase with price momentum and how Stop-Loss is following the trade reducing the risk!
2) Same intraday trading day for SPY (S&P500 ETF TRUST) with 3 Take-Profit targets with static Stop-Loss.
3) Same intraday trading day for SPY (S&P500 ETF TRUST) with 3 Take-Profit targets with dynamic Stop-Loss.
You can see how Stop-Loss was moved once TP1 is taken!
===========================================================================
Trade Analysis and Cleanup Settings
---------------------------------------------------------------------------
>>>>> Candle Analysis | Candle Color signal confirmation: If closed candle bar color does not match the signal direction > no trade will be open.
>>>>> Candle Analysis | Skip opposite candle signals: If closed candle bar color will match the signal direction, but candle structure will be opposite (for example: bearish green hammer, long high stick on top of a small green square) > no trade will be open.
>>>>> Candle Analysis | Skip doji candle signals: If closed candle bar will be the uncertain doji > no trade will be open.
>>>>> Divergence/Oscillator Analysis | EWO (Elliot Wave Oscillator) signal confirmation: LONG will only be open if at signal, EWO is green or will be at bullish slope (you can select which setting you desire), SHORT if EWO is red or will be at bearish slope.
>>>>> Divergence/Oscillator Analysis | VWAP signal confirmation: LONG will only be open if at signal, the price will be above VWAP, SHORT if below.
>>>>> Divergence/Oscillator Analysis | Moving Average signal confirmation: LONG will only be open if at signal, the price will be above selected Moving Average, SHORT if below.
>>>>> Divergence/Oscillator Analysis | ATR signal confirmation: LONG will only be open if at signal, the price will be above ATR, SHORT if below.
>>>>> Divergence/Oscillator Analysis | RSI + MACD signal confirmation: LONG will only be open if at signal, RSI + MACD will be bullish, SHORT if RSI + MACD will be bearish.
>>>>> Volume signal confirmation: LONG/SHORT will only be open if closing candle volume is 150% above average Volume based on the Volume Length.
===========================================================================
Alert Settings (you don’t have to touch this section unless you will be using TradingView alerts through a Webhook to use with trading bot)
---------------------------------------------------------------------------
Here is how a LONG OPEN alert looks like (each label is customizable + I can add up more items/labels if needed):
COIN: BTCUSD
TIMEFRAME: 15M
LONG: OPEN
ENTRY: 20000
TP1: 20500
TP2: 21000
TP3: 21500
SL: 19000
Leverage: 0
===========================================================================
Adding Alerts in TradngView
---------------------------------------------------------------------------
-Right-click anywhere on the TradingView chart
-Click on Add alert
-Condition: Select this indicator by it’s name
-Alert name: Whatever you want
-Hit “Create”
-Note: If you change ANY Settings within the indicator – you must DELETE the current alert and create a new one per steps above, otherwise it will continue triggering alerts per old Settings!
===========================================================================
If you have any questions or issues with the indicator, please message me directly via TradingView.
---------------------------------------------------------------------------
Good Luck! (NOTE: Trading is very risky, past performance is not necessarily indicative of future results, so please trade responsibly!)

Kioseff Trading - AI-Powered Strategy Optimizer Introducing the Kioseff Trading AI-Powered Strategy Optimizer
Optimize and build your trading strategy with ease, no matter your experience level. The Kioseff Trading AI-Powered Strategy Optimizer allows traders to efficiently test and refine strategies with thousands of different profit targets and stop loss settings. Integrated with TradingView's backtester, this tool simplifies strategy optimization, strategy testing, and alert setting, enabling you to enhance your strategy with AI-driven insights.
Key Features:
Comprehensive Testing : Simultaneously test thousands of profit targets and stop losses to fine-tune your strategy.
Dual Strategy Optimization : Adjust and optimize both long and short strategies for balanced performance.
AI Integration : Elevate your strategy with heuristic-based adaptive learning, turning it into a smart, AI-assisted system.
Detailed Analysis : View critical metrics like profit factor, win rate, max drawdown, and equity curve, presented in a strategy script format.
Customizable Alerts : Set alerts for the best version of your strategy.
Flexible Risk Management : Optimize various stop loss types, including profit targets, limit orders, OCO orders, trailing stops, and fixed stops.
Targeted Goals : Choose optimization goals like highest win rate, maximum net profit, or most efficient profit.
Indicator Compatibility : Integrate any strategy/indicator, whether it’s your creation, a favorite author’s, or any public TradingView indicator.
Accessible Design : Navigate a user-friendly interface suitable for traders of all skill levels. No code required.
Precision Lock-In : “Lock” your optimal profit target or stop loss to drill down into precision testing of other variables.
How it works
It's important to remember that merely having the AI-Powered Strategy Optimizer on your chart doesn't automatically provide you with the best strategy. You need to follow the AI's guidance through an iterative process to discover the optimal settings for your strategy.
The Trading Strategy Optimizer is a versatile tool tailored for both non-coding traders and seasoned algorithmic trading professionals. Let's start with no-code-required instructions on how to use the optimizer.
Instructions: How To Optimize Your Strategy Without Code
1. Build your strategy in the settings
The image above shows explanations for each key setting.
Note: This example uses the RSI indicator to initiate a long trade whenever it dips below the 30 mark.
Ensure that the indicator you wish to optimize is already applied to your chart . This enables the Trading Strategy Optimizer to interact with the indicator and finetune profit targets and stop losses effectively.
Because the indicator is plotted on the chart I can access the indicator with the Trading Strategy Optimizer and optimize profit targets and stop losses for it.
2. Leverage AI Recommendations
Optimization Prompt: After you load your strategy, the tool advises you on new TP and SL levels that could be more profitable.
When your strategy is set, the tool gives you tips for where to set your profit goal (TP) and your stop loss to help you optimize your strategy. It'll tell you if there's a better range for these settings based on past results.
Follow Suggestions: Keep updating your TP and SL according to the tool's suggestions until it says "Best Found".
Final Result: The last image shows the best settings found by the indicator.
(Optional Step 3)
3. Lock the profit target or stop loss to further fine tune your strategy
Continue following the AI’s suggestion until “Best Found” is displayed.
Note: you can select lock either your stop loss or profit target for fine tuning. For this demonstration we will lock our profit target.
Code-Required Instructions (Optional)
You can backtest more code-intensive strategies, such as harmonic patterns, traditional chart patterns, candlestick patterns, Elliot wave, etc., by coding the entry condition in your own script and loading it into the Trading Strategy Optimizer. Let's dial in on how to achieve this!
1. You must create an integer variable in your script with an initial value of "0".
2. Define your entry condition in the code. Once complete, assign the value "1" to the variable you created if the entry condition is fulfilled.
3. Plot your variable.
4. Select the plotted variable in the settings for the Trading Strategy Optimizer
The image above shows a coded entry condition for the linear regression channel (which can be any indicator). When price crosses under and closes below the lower line our variable "strategyEntryVariable" is assigned the value "1".
The Trading Strategy Optimizer will treat this change in value from "0" to "1" as an entry signal and enter long/short up to 1000 times at the price where the entry condition was fulfilled.
5. Test Your Strategy
The image above shows the completion of the process! Keep applying the steps we described. Stick with the AI's recommendations until you see “Best Found” show up.
By following these instructions, you can build, test, and optimize almost any trading indicator or strategy!
So, just note that the Trading Strategy Optimizer considers a change in value of a plotted variable from "0" to "1" as an entry signal! So long as you follow this rule you should be able to test and optimize any conceivable, Pine Script compatible strategy!
AI Mode
AI Mode incorporates Heuristic-Based Adaptive Learning to fine-tune trading strategies in a continuous manner. This feature consists of two main components:
Heuristic-Based Decision Making: The algorithm evaluates multiple versions of your strategy using specific metrics such as Profit and Loss (PNL), Win Rate, and Most Efficient Profit. These metrics act as heuristics to assist the algorithm in identifying suitable profit targets and stop losses for trade execution.
Online Learning: The algorithm updates the performance evaluations of each strategy based on incoming market data. This enables the system to adapt to current market conditions.
Incorporating both heuristic-based decision-making and online learning, this feature aims to provide a framework for trading strategy optimization.
Settings
AI Mode Aggressiveness:
Description: The "AI Mode Aggressiveness" setting allows you to fine-tune the AI's trading behavior. This setting ranges from "Low" To "High, with higher aggressiveness indicating a more assertive trading approach.
Functionality: This feature filters trading strategies based on a proprietary evaluation method. A higher setting narrows down the strategies that the AI will consider, leaning towards more aggressive trading. Conversely, a lower setting allows for a more conservative approach by broadening the pool of potential strategies.
Adaptive Learning Aggressiveness:
Description: When Adaptive Learning is enabled, the "Adaptive Learning Aggressiveness" setting controls how dynamically the AI adapts to market conditions using selected performance metrics.
Functionality: This setting impacts the AI's responsiveness to shifts in strategy performance. By adjusting this setting, you can control how quickly the AI moves away from strategies that may have been historically successful but are currently underperforming, towards strategies that are showing current promise.
Additional Settings
Optimization
Trading system optimization is immensely advantageous when executed with prudence.
Technical-oriented, mechanical trading systems work when a valid correlation is methodical to the extent that an objective, precisely-defined ruleset can consistently exploit it. If no such correlation exists, or a technical-oriented system is erroneously designed to exploit an illusory correlation (absent predictive utility), the trading system will fail.
Evaluate results practically and test parameters rigorously after discovery. Simply mining the best-performing parameters and immediately trading them is unlikely a winning strategy. Put as much effort into testing strong-performing parameters and building an accompanying system as you would any other trading strategy. Automated optimization involves curve fitting - it's the responsibility of the trader to validate a replicable sequence or correlation and the trading system that exploits it.

EMA bands + leledc + bollinger bands trend following strategy v2The basics:
In its simplest form, this strategy is a positional trend following strategy which enters long when price breaks out above "middle" EMA bands and closes or flips short when price breaks down below "middle" EMA bands. The top and bottom of the middle EMA bands are calculated from the EMA of candle highs and lows, respectively.
The idea is that entering trades on breakouts of the high EMAs and low EMAs rather than the typical EMA based on candle closes gives a bit more confirmation of trend strength and minimizes getting chopped up. To further reduce getting chopped up, the strategy defaults to close on crossing the opposite EMA band (ie. long on break above high EMA middle band and close below low EMA middle band).
This strategy works on all markets on all timeframes, but as a trend following strategy it works best on markets prone to trending such as crypto and tech stocks. On lower timeframes, longer EMAs tend to work best (I've found good results on EMA lengths even has high up to 1000), while 4H charts and above tend to work better with EMA lengths 21 and below.
As an added filter to confirm the trend, a second EMA can be used. Inputting a slower EMA filter can ensure trades are entered in accordance with longer term trends, inputting a faster EMA filter can act as confirmation of breakout strength.
Bar coloring can be enabled to quickly visually identify a trend's direction for confluence with other indicators or strategies.
The goods:
Waiting for the trend to flip before closing a trade (especially when a longer base EMA is used) often leaves money on the table. This script combines a number of ways to identify when a trend is exhausted for backtesting the best early exits.
"Delayed bars inside middle bands" - When a number of candle's in a row open and close between the middle EMA bands, it could be a sign the trend is weak, or that the breakout was not the start of a new trend. Selecting this will close out positions after a number of bars has passed
"Leledc bars" - Originally introduced by glaz, this is a price action indicator that highlights a candle after a number of bars in a row close the same direction and result in greatest high/low over a period. It often triggers when a strong trend has paused before further continuation, or it marks the end of a trend. To mitigate closing on false Leledc signals, this strategy has two options: 1. Introducing requirement for increased volume on the Leledc bars can help filter out Leledc signals that happen mid trend. 2. Closing after a number of Leledc bars appear after position opens. These two options work great in isolation but don't perform well together in my testing.
"Bollinger Bands exhaustion bars" - These bars are highlighted when price closes back inside the Bollinger Bands and RSI is within specified overbought/sold zones. The idea is that a trend is overextended when price trades beyond the Bollinger Bands. When price closes back inside the bands it's likely due for mean reversion back to the base EMA in which this strategy will ideally re-enter a position. Since the added RSI requirements often make this indicator too strict to trigger a large enough sample size to backtest, I've found it best to use "non-standard" settings for both the bands and the RSI as seen in the default settings.
"Buy/Sell zones" - Similar to the idea behind using Bollinger Bands exhaustion bars as a closing signal. Instead of calculating off of standard deviations, the Buy/Sell zones are calculated off multiples of the middle EMA bands. When trading beyond these zones and subsequently failing back inside, price may be due for mean reversion back to the base EMA. No RSI filter is used for Buy/Sell zones.
If any early close conditions are selected, it's often worth enabling trade re-entry on "middle EMA band bounce". Instead of waiting for a candle to close back inside the middle EMA bands, this feature will re-enter position on only a wick back into the middle bands as will sometimes happen when the trend is strong.
Any and all of the early close conditions can be combined. Experimenting with these, I've found can result in less net profit but higher win-rates and sharpe ratios as less time is spent in trades.
The deadly:
The trend is your friend. But wouldn't it be nice to catch the trends early? In ranging markets (or when using slower base EMAs in this strategy), waiting for confirmation of a breakout of the EMA bands at best will cause you to miss half the move, at worst will result in getting consistently chopped up. Enabling "counter-trend" trades on this strategy will allow the strategy to enter positions on the opposite side of the EMA bands on either a Leledc bar or Bollinger Bands exhaustion bar. There is a filter requiring either a high/low (for Leledc) or open (for BB bars) outside the selected inner or outer Buy/Sell zone. There are also a number of different close conditions for the counter-trend trades to experiment with and backtest.
There are two ways I've found best to use counter-trend trades
1. Mean reverting scalp trades when a trend is clearly overextended. Selecting from the first 5 counter-trend closing conditions on the dropdown list will usually close the trades out quickly, with less profit but less risk.
2. Trying to catch trends early. Selecting any of the close conditions below the first 5 can cause the strategy to behave as if it's entering into a new trend (from the wrong side).
This feature can be deadly effective in profiting from every move price makes, or deadly to the strategy's PnL if not set correctly. Since counter-trend trades open opposite the middle bands, a stop-loss is recommended to reduce risk. If stop-losses for counter-trend trades are disabled, the strategy will hold a position open often until liquidation in a trending market if th trade is offsides. Note that using a slower base EMA makes counter-trend stop-losses even more necessary as it can reduce the effectiveness of the Buy/Sell zone filter for opening the trades as price can spend a long time trending outside the zones. If faster EMAs (34 and below) are used with "Inner" Buy/Zone filter selected, the first few closing conditions will often trigger almost immediately closing the trade at a loss.
The niche:
I've added a feature to default into longs or shorts. Enabling these with other features (aside from the basic long/short on EMA middle band breakout) tends to break the strategy one way or another. Enabling default long works to simulate trying to acquire more of the asset rather than the base currency. Enabling default short can have positive results for those high FDV, high inflation coins that go down-only for months at a time. Otherwise, I use default short as a hedge for coins that I hold and stake spot. I gain the utility and APR of staking while reducing the risk of holding the underlying asset by maintaining a net neutral position *most* of the time.
Disclaimer:
This script is intended for experimenting and backtesting different strategies around EMA bands. Use this script for your live trading at your own risk. I am a rookie coder, as such there may be errors in the code that cause the strategy to behave not as intended. As far as I can tell it doesn't repaint, but I cannot guarantee that it does not. That being said if there's any question, improvements, or errors you've found, drop a comment below!

Stochastic Moving AverageHi all,
This Strategy script combines the power of EMAs along with the Stochastic Oscillator in a trend following / continuation manner, along with some cool functionalities.
I designed this script especially for trading altcoins, but it works just as good on Bitcoin itself and on some Forex pairs.
______ SIGNALS ______
The script has 4 mandatory conditions to unlock a trading signal. Find these conditions for a long trade below (works the exact other way round for shorts)
- Fast EMA must be higher than Slow EMA
- Stochastic K% line must be in oversold territory
- Stochastic K% line must cross over Stochastic D% line
- Price as to close between slow EMA and fast EMA
Once all the conditions are true, a trade will start at the opening of the next
______ SETTINGS ______
- Trade Setup:
Here you can choose to trade only longs or shorts and change your Risk:Reward.
You can also decide to adjust your volume per position according to your risk tolerance. With “% of Equity” your stop loss will always be equal to a fixed percentage of your initial capital (will “compound” overtime) and with “$ Amount” your stop loss will always be 'x' amount of the base currency (ex: USD, will not compound)
Stop Loss:
The ATR is used to create a stop loss that matches current volatility. The multiplier corresponds to how many times the ATR stop losses and take profits will be away from closing price.
- Stochastic:
Here you can find the usual K% & D% length and overbought (OB) and oversold (OS) levels.
The “Stochastic OB/OS lookback” increase the tolerance towards OB/OS territories. It allows to look 'x' bars back for a value of the Stochastic K line to be overbought or oversold when detecting an entry signal.
The “All must be OB/OS” refers to the previous “Stochastic OB/OS lookback” parameter. If this option is ticked, instead of needing only 1 OB/OS value within the lookback period to get a valid signal, now, all bars looked back must be OB/OS.
The color gradient drawn between the fast and slow EMAs is a representation of the Stochastic K% line position. With default setting colors, when fast EMA > slow EMA, gradient will become solid blue when Stochastic is oversold and when slow EMA > fast EMA, gradient will become solid blue when Stochastic is overbought
- EMAs:
Just pick your favorite ones
- Reference Market:
An additional filter to be certain to stay aligned with the current a market index trend (in our case: Bitcoin). If selected reference market (and timeframe) is trading above selected EMA, this strategy will only take long trades (vice-versa for shorts) Because, let’s face it… even if this filter isn’t bulletproof, you know for sure that when Bitcoin tanks, there won’t be many Alts going north simultaneously. Once again, this is a trend following strategy.
A few tips for increased performance: fast EMA and D% Line can be real fast… 😉
As always, my scripts evolve greatly with your ideas and suggestions, keep them coming! I will gladly incorporate more functionalities as I go.
All my script are tradable when published but remain work in progress, looking for further improvements.
Hope you like it!

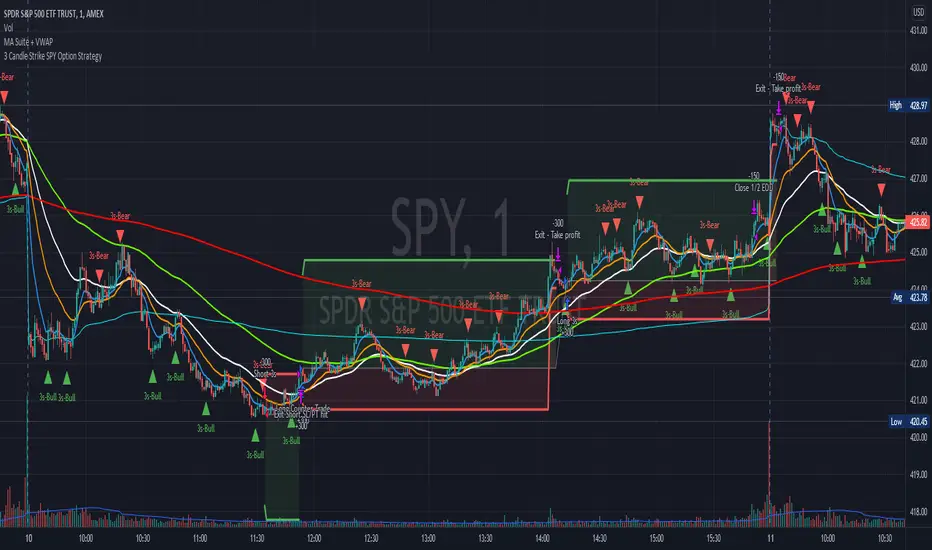
3 Candle Strike SPY Option StrategyImportant notes:
1. This strategy is designed for same day SPY option scalping. All profit shown in back testing report is based on Profit/Loss (P/L) estimates from trading options with approximately 7.5 weeks of data. By default, it is set to 10 option contracts. By default the initial capital is set to $5000.
2. This strategy also takes into account of extended market data, so turn it on for it to work as intended.
3. This strategy is mainly developed for SPY trading on 1 min chart, it probably will not work with other tickers without tweaking all the parameters first.
4. At the time of publish, the market is experiencing high volatility. Keep that in mind as market conditions changes constantly.
How it works:
Basic idea of this strategy is to look for 3 candle reversal pattern within trending market structure. The 3 candle reversal pattern consist of 3 consecutive bullish or bearish candles, followed by an engulfing candle in the opposite direction. This pattern usually signals a reversal of short term trend (a.k.a pullbacks). This strategy uses multiple moving averages to filter long or short entries. For example, if the 21 smoothed moving average is above the 50, only look for long (bullish) entries, and vise versa. There are settings to change these moving average periods to suit your needs. Linear Regression to determine whether the market is trending. The 3 candle pattern is more successful under trending market.
This strategy aims for approximately 1:3 risk to reward ratio. Stop losses are calculated using the closest low or high values for long or short entries, respectively, with an offset using a percentage of the daily ATR value. This allows some price fluctuation without being stopped out prematurely. Price target is calculated by multiplying the difference between the entry price and the stop loss by a factor of 3. When price target is reach, this strategy will set stop loss at the price target and wait for exit conditions to maximize potential profit.
By default, the strategy signals a trade in the opposite direction if the previous one had resulted in a loss. Often times, this opposite trade results in profit.
This strategy automatically signal to close all trades at 3:50 pm EST at the end of the day.
Enjoy~!!! Let's all make $$$
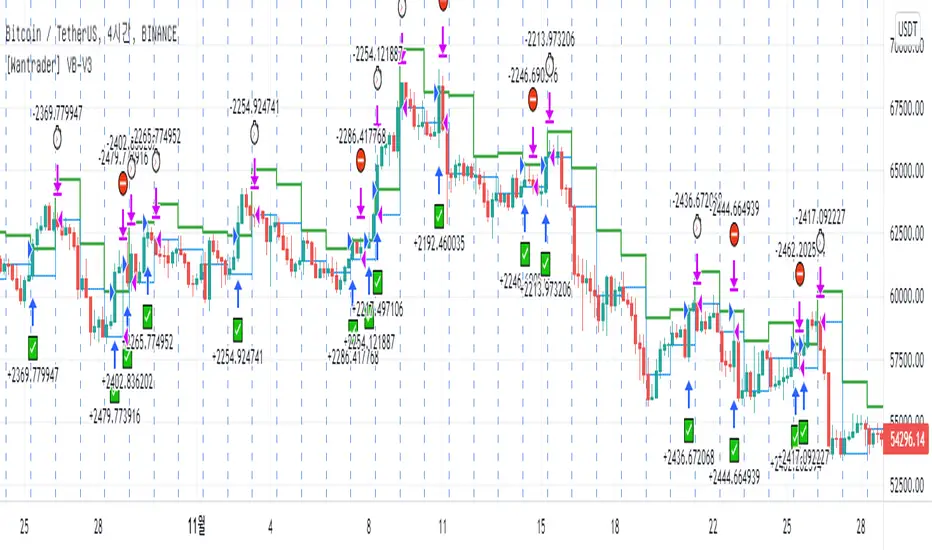
[Wantrader] Volatility Breakout Strategy V3This is the Wantrader's volatility breakthrough version 9,
which developed Larry Williams' volatility breakthrough strategy.
The following elements are included.
- Entry : Enter the market price, calculated by the volatility (TR) * ratio (K) of the previous day.
- Exit : Based on the selected time frame, closing the closing price, closing the market price,
- Stop loss: When it breaks through the entry price and buys, returns to the market price (the previous day's closing price) and changes to bear candle, stop loss.
- Long/short comparison: When short version is selected, it shows the result of short instead of long.
This strategy is a low-level strategy.
When used in practice, it can be stronger and more compliant than expected, but it is not smart.
I recommend you to develop a more hidden edge and use it as a drawing paper to create your own strategy.
Through the option settings,
I'll check if it's right for my first salary or at different times.
It will be an opportunity to think about why there is a difference in profits between Long and Short.
Also, the result shows the big difference between having and not having a loss.
I hope it will be an opportunity to break the relationship in the future.
========================================================================================
래리윌리엄스의 변동성돌파전략을 발전시킨
원트레이더 변동성돌파 버전3 입니다.
아래 요소가 포함되어있습니다.
- 진입 : 전일변동성(TR) * 비율(K) 로 계산한 진입가에, 시장가 진입
- 청산 : 선택한 타임프레임 기준으로 종가에, 시장가 청산
- 손절 : 진입가 돌파하여 매수 후, 당일 시가(전일 종가)로 돌아와서 음봉으로 바뀔때 손절
- 롱/숏 비교 : 숏버전을 선택하면 롱대신 숏으로만 처리한 결과를 보여줌
본 전략은 레벨이 낮은 전략으로
실전에서 사용 시 생각보다 강건하고 준수할 순 있으나 스마트하진 못합니다.
더 숨겨진 엣지를 개발하여 자신만의 전략을 만들기 위한 도화지 처럼 사용하시길 추천드립니다.
옵션 설정을 통해
일봉에서 잘 맞는지 다른 시간대에서 맞는지 등을 확인하고
롱과 숏의 수익의 차이는 왜 나는 것인지 고민해보는 계기가 될 것입니다.
또한 손절이 있는 것과 없는 것의 큰 차이를 결과로 확인하여
앞으로 반드시 손절을 넣게 되는 계기가 되길 기원합니다.
[Joy] Aladdin Long Trading Strategy 1.0.0 AlphaAladdin's Long trading strategy is to test out Aladdin for long trades only
This strategy is mainly used to test whether Aladdin is suitable for a coin/stocks/futures or for any trading. The profitability, average drawdown, average profits, etc are used by me to decide whether to use it for trading.
What is Aladdin and what does it do?
Using the volume and gradual flow of non-interrupted data (wicks and body of the candles), it tries to detect the macro condition of the market so that one may know in which direction the market is flowing.
* Bearish / Sell sign: On the candle's close, I open a short position
* Bullish sign: On the candle's close, I open a long position
* I take at least 50% profit when the indicator indicates to do so. One can configure that value as desired from the configuration depending on one's risk/money management. I might even convert some portion of the position into stable coins.
FAQ
Q: Does it use some EMA /MA/etc.? Does it use any indicator with tweaked settings?
Answer: No.
Q: What does it mostly depend on?
Answer: Volume and gradual flow of non-interrupted data. The logic depends purely on volume , price bars and the wicks.
Q: Does it work with all coins, stocks, futures, instruments?
Answer: I prefer to use the exchange with the best possible data. Then backtest out to find the best possible timeframe, stop loss and target all derived from this script data.
Q: Can you make it free or make it open source?
Answer: There is no free lunch in this world. I will never reveal or share the source code!
Q: Do you provide ongoing support for the indicator?
Answer: Yes, as long as I can, I will continue updating the indicator
Q: Are the bullish /buy & the bearish/sell markers automatic?
Answer: I have no control over the markers. It is driven purely by logic from the script.
Q: Is this financial advice?
Answer: This is not financial advice. I do not guarantee any profit or loss. I am not responsible for any of your losses or profits. My indicators do not assure profit or loss. It also does not auto-open or auto-close a trade.
Assumptions:
Only long trades are opened and closed. No short trades.
Starting Capital: $20,000
Order Size: 20% of Capital
Data used: Whatever data is available from 2011 till today on Trading view
Findings:
INDEX: BTCUSD 83% profitability using 2day tf
54 closed trades
Profit factor: 16
Sortino Ratio: 5.2
Average Winning Trade: 30%
Average Losing Trade: 9.12%
Largest Winning Trade: 1218%
Largest Losing Trade: 20.25%
Below are the profitability rate for the timeframe and the coins listed as found by running the trading strategy over the following as of today (Aug 1st 2021 12:40 pm Sydney Time).
⚜️ INDEX:BTCUSD 83% using 2day tf
⚜️INDEX:ETHUSD 80% using 1day tf
⚜️FTTUSD 81% using 2day tf
⚜️SRMUSD 71% using 1day tf
⚜️ADAUSDT 81% using 2day tf
⚜️ALGOUSD > 90% using 2day tf
⚜️ALTPERP 81% using 2day tf
⚜️AVAXUSDT 75% using 1day tf
⚜️BANDUSD > 90% using 2day tf
⚜️BCHUSD 82% using 2day tf
⚜️BNBUSD 79% using 1day tf
⚜️BNBUSD 85% using 2day tf
⚜️CHZUSD 71% using 1day tf
⚜️COMPUSD 81% using 1day tf
⚜️DOGEUSD 77% using 1day tf
⚜️EXCHPERP 83% using 1day tf
⚜️FILUSD > 90% using 1day tf
⚜️FTMUSD 70% using 2day tf
⚜️HTUSDT 75% using 2day tf
⚜️KINUSD >90% using 2day tf
⚜️LINKPERP 85% using 2day tf
⚜️LTCUSD 80% using 2day tf
⚜️MATICUSD 77% using 2day tf
⚜️NEOUSD 80% using 1day tf
⚜️NEXOUSD > 90% using 1day tf
⚜️OKBUSD 71% using 1day tf
⚜️OMGUSD 75% using 1day tf
⚜️RSRUSD 87% using 1day tf
⚜️RUNEUSD > 90% using 1day tf
⚜️SHITPERP > 90% using 1day tf
⚜️SOLUSD 84% using 1day tf
⚜️SUSHIUSD 71% using 1day tf
⚜️THETAUSD > 90% using 2day tf
⚜️UNIPERP 83% using 1day tf
⚜️VERTPERP > 90% using 1day tf
⚜️XAUUSD 63% using 2day tf
⚜️XTZUSD 83% using 2day tf
⚜️ZECUSD 72% using 2day tf
Disclaimer:
No one knows what will happen in the future. DYOR and decide on your own conditions. Do realize that neither I nor my indicator can guarantee any profit or loss. And there is no assurance that any trade will ever result in any profit. It is not financial advice.

Breakout Trend Trading Strategy - V1Strategy in nutshell:
This strategy is made to be used in daily time-frames. Works better on trending instruments where volume is available. Hence, this is more suitable for trending shares rather than currencies, commodities and indexes where volume data is either not present or not reliable.
Breakout signifies the continuation of trend. Hence, trade in the direction of breakouts. Breakouts are calculated based on high volume and price movement in a day. This will be combined with few other conditions to generate buy and sell signals along with stop and compound targets. Supertrend is used for trend bias. Our buy and sell targets do not directly depend on the bias. But, entry criteria in opposite trend is made much difficult than that of trend direction. Further explanation of method and input parameters are explained below.
Backtesting parameters :
Capital and position sizing : Capital and position sizing parameters are set to test investing 2000 wholly on certain stock without compounding.
Initial Capital : 2000
Order Size : 100% of equity
Pyramiding : 1
ExitOnSignal : If unchecked exit is triggered solely on trailing stop
Trade Direction : Long, Short or All. Short condition is riskier than long conditions and often results in losses as per my observation. On most of the stocks trending up, strategy will not generate any short signals. This is achieved by comparing yearly high lows to previous two years to decide whether to allow short or long entries.
allowImmediateCompound : Applicable only if compounding/pyramiding is enabled in trade. If checked allows to place compounding orders immediately. If unchecked, it waits for stopline to cross order price before placing next compound.
Display Mode :
Targets : Whenever breakout happens, show marker for upTarget and downTarget
TargetChannel : Show up target and downtarget as a channel
Target With Stop : Along with targets, show also stop levels for breakouts
Up Channel : Channel created from UpTarget and respective stops
Down Channel : Channel created from DownTarget and respective stops
ShowTrailingStop : Shows trailing stop and compound lines when there is a trading position.
ShowTargetLevels : Shows Buy Sell target levels along with stop and compound lines. Trades are done as market orders. Hence, target levels are displayed after strategy makes the trade. Since only one order allowed per side without compounding, target, stop and compound levels are shown sometimes even without trade being made. These can be considered as entry levels if there is no existing position.
ShowPreviousLevels : Shows previous buy/sell target levels. When enabled, layout can look messy.
StopMultiplyer: To Set trailing stop loss.
BacktestYears: Number of years to include in backtest
So far my test cases are:
Positive : AAPL, AMZN, TSLA, RUN, VRT, ASX:APT
Negative Test Cases: WPL, WHC, NHC, WOW, COL, NAB (All ASX stocks)
Special test case: WDI
Negative test cases still show losses in backtesting. I have attempted including many conditions to eliminate or reduce the loss. But, further efforts has resulted in reduction in profits in positive cases as well. Still experimenting. Will update whenever I find improvements. Comments and suggestions welcome :)

Grid Like StrategyIt is possible to use progressive position sizing in order to recover from past losses, a well-known position sizing system being the "martingale", which consists of doubling your position size after a loss, this allows you to recover any previous losses in a losing streak + winning an extra. This system has seen a lot of attention from the trading community (mostly from beginners), and many strategies have been designed around the martingale, one of them being "grid trading strategies".
While such strategies often shows promising results on paper, they are often subjects to many frictions during live trading that makes them totally unusable and dangerous to the trader. The motivations behind posting such a strategy isn't to glorify such systems, but rather to present the problems behind them, many users come to me with their ideas and glorious ways to make money, sometimes they present strategies using the martingale, and it is important to present the flaws of this methodology rather than blindly saying "you shouldn't use it".
Strategy Settings
Point determines the "grid" size and should be adjusted accordingly to the scale of the symbol you are applying the strategy to. Higher value would require larger price movements in order to trigger a trade, as such higher values will generate fewer trades.
The order size determines the number of contracts/shares to purchase.
The martingale multiplier determines the factor by which the position size is multiplied after a loss, using values higher to 2 will "squarify" your balance, while a value of 1 would use a constant position sizing.
Finally, the anti-martingale parameter determines whether the strategy uses a reverse martingale or not, if set to true then the position size is multiplied after any wins.
The Grid
Grid strategies are commons and do not present huge problems until we use certain position sizing methods such as the martingale. A martingale is extremely sensitive to any kind of friction (frictional costs, slippage...etc), the grid strategy aims to provide a stable and simple environment where a martingale might possibly behave well.
The goal of a simple grid strategy is to go long once the price crossover a certain level, a take profit is set at the level above the current one and stop loss is placed at the level below the current one, in a winning scenario the price reach the take profit, the position is closed and a new one is opened with the same setup. In a losing scenario, the price reaches the stop loss level, the position is closed and a short one is opened, the take profit is set at the level below the current one, and a stop loss is set at the level above the current one. Note that all levels are equally spaced.
It follows from this strategy that wins and losses should be constant over time, as such our balance would evolve in a linear fashion. This is a great setup for a martingale, as we are theoretically assured to recover all the looses in a losing streak.
Martingale - Exponential Decays - Risk/Reward
By using a martingale we double our position size (exposure) each time we lose a trade, if we look at our balance when using a martingale we see significant drawdowns, with our balance peaking down significantly. The martingale sequence is subject to exponential growth, as such using a martingale makes our balance exposed to exponential decays, that's really bad, we could basically lose all the initially invested capital in a short amount of time, it follows from this that the theoretical success of a martingale is determined by what is the maximum losing streak you can endure
Now consider how a martingale affects our risk-reward ratio, assuming unity position sizing our martingale sequence can be described by 2^(x-1) , using this formula we would get the amount of shares/contracts we need to purchase at the x trade of a losing streak, we would need to purchase 256 contracts in order to recover from a losing streak of size 9, this is enormous when you take into account that your wins are way smaller, the risk-reward ratio is totally unfair.
Of course, some users might think that a losing streak of size 9 is pretty unlikely, if the probability of winning and losing are both equal to 0.5, then the probability of 9 consecutive losses is equal to 0.5^9 , there are approximately 0.2% of chance of having such large losing streak, note however that under a ranging market such case scenario could happen, but we will see later that the length of a losing streak is not the only problem.
Other Problems
Having a capital large enough to tank 9any number of consecutive losses is not the only thing one should focus on, as we have to take into account market prices and trading dynamics, that's where the ugly part start.
Our first problem is frictional costs, one example being the spread, but this is a common problem for any strategy, however here a martingale is extra sensitive to it, if the strategy does not account for it then we will still double our positions costs but we might not recover all the losses of a losing streak, instead we would be recovering only a proportion of it, under such scenario you would be certain to lose over time.
Another problem are gaps, market price might open under a stop-loss without triggering it, and this is a big no-no.
Equity of the strategy on AMD, in a desired scenario the equity at the second arrow should have been at a higher position than the equity at the first arrow.
In order for the strategy to be more effective, we would need to trade a market that does not close, such as the cryptocurrency market. Finally, we might be affected by slippage, altho only extreme values might drastically affect our balance.
The Anti Martingale
The strategy lets you use an anti-martingale, which double the position size after a win instead of a loss, the goal here is not to recover from a losing strike but instead to profit from a potential winning streak.
Here we are exposing your balance to exponential gross but you might also lose a trade at the end a winning streak, you will generally want to reinitialize your position size after a few wins instead of waiting for the end of a streak.
Alternative
You can use other-kind of progressions for position sizing, such as a linear one, increasing your position size by a constant number each time you lose. More gentle progressions will recover a proportion of your losses in a losing streak.
You can also simulate the effect of a martingale without doubling your position size by doubling your target profit, if for example you have a 10$ profit-target/stop-loss and lose a trade, you can use a 20$ profit target to recover from the lost trade + gain a profit of 10$. While this approach does not introduce exponential decay in your balance, you are betting on the market reaching your take profits, considering the fact that you are doubling their size you are expecting market volatility to increase drastically over time, as such this approach would not be extremely effective for high losing streak.
Conclusion
You will see a lot of auto-trading strategies that are based on a grid approach, they might even use a martingale. While the backtests will look appealing, you should think twice before using such kind of strategy, remember that frictional costs will be a huge challenge for the strategy, and that it assumes that the trader has an important initial capital. We have also seen that the risk/reward ratio is theoretically the worst you can have on a strategy, having a low reward and a high risk. This does not mean that progressive position sizing is bad, but it should not be pushed to the extreme.
It is nice to note that the martingale is originally a betting system designed for casino games, which unlike trading are not subject to frictional costs, but even casino players don't use it, so why would you?
Thx for reading

Two Take Profit StrategyThis script is for research purposes only. I am not a financial advisor.
Entry Condition
This strategy is based on two take profit targets and scaling out strategy. The entry rule is very simple. Whenever the EMA crossover WMA, the long trade is taken and vice versa.
Take Profit and Stop Loss
The first take profit is set at 20 pips above the long entry and the second take profit is set at 40 pips above the long entry. Meanwhile, the stop loss is set at 20 pips below the long entry.
Money Management
When the first take profit is achieved, half of the position is closed. The rest of the position is open to achieve either second take profit or stop loss.
There are three outcomes when using this strategy. Let's say you enter the trade with 200 lot size and you are risking 2% of your equity.
1. The first outcome is when the price hits stop loss, you lose the entire 2%.
2. The second outcome is when the price hits the first take profit and you close half of your position. Meaning that you have gained 1%. Then you let the trade running and eventually it hits stop loss. The total loss is 0% because the remaining lot size which is 200/2=100 times by 20pips is 1%. You have gained the earlier 1% and then loss 1%. At this point, you are at break even.
3. The third outcome is similar to the second out but instead of hiring stop loss, the trade is running to your favor and hits the second take profit.
Therefore, you gained 1% from the first take profit and you gained another 2% for the second take profit. Your total gained is 3%
Summary
The reason behind this strategy is to minimize risk. with normal strategy, you only have two outcomes which are either win or loss. With this strategy, you have three outcomes which are win, loss or break even.

AMF PG Strategy v2.3AMF PG Strategy v2.3
1. Core Philosophy: Filtered and Volatility-Aware Trend Following
"AMF PG Strategy" is an advanced trend-following system designed to adapt to the dynamic nature of modern markets. The strategy's core philosophy is not just to follow the trend but also to wait for the right conditions to enter the market.
This is not a "black box." It is a rules-based framework that gives the user full control over various market filters. By requiring multiple conditions to be met simultaneously, the strategy aims to filter out low-quality signals and focus only on high-probability trend opportunities.
2. Core Engine: AMF PG Trend Following
At the heart of the strategy is a proprietary, volatility-aware trend-following mechanism called AMF PG (Praetorian Guard). This engine operates as follows:
Dynamic Bands: Creates a dynamic upper and lower band around the price that is constantly recalculated. The width of these bands is not fixed; It dynamically adjusts based on recent market volatility, volume flow, and price expansion. This adaptive structure allows the strategy to adapt to both calm and high-volatility markets.
Entry Signals: A buy signal is triggered when the price rises above the upper band. A sell signal is triggered when the price falls below the lower band. However, these signals are executed only when all the active filters described below give the green light.
Trailing Stop-Loss: When a position is entered, the opposite band automatically acts as a trailing stop-loss level. For example, when a buy position is opened, the lower band follows the price as a stop-loss. This allows for profit retention and trend continuation.
3. Multi-Layered Filter System: Understanding the Market
The power of this strategy comes from its modular filter system, which allows the user to filter market conditions based on their own analysis. Each filter can be enabled or disabled individually in the settings:
Filter 1: Trend Strength (ADX Filter): This filter confirms whether there is a strong trend in the market. It uses the ADX (Average Directional Index) indicator and only allows trades if the ADX value is above a certain threshold. This helps avoid trading in weak or directionless markets. It also confirms the direction of the trend by checking the position of the DMI (+DI and -DI) lines.
Filter 2: Sideways Market (Chop Index Filter): This filter determines whether the market is excessively choppy or directionless. Using the Chop Index, this filter aims to protect against fakeouts by blocking trades when the market is highly indecisive.
Filter 3: Market Structure (Hurst Exponent Filter): This is one of the strategy's most advanced filters. It analyzes the current market behavior using the Hurst Exponent. This mathematical tool attempts to determine whether a market tends to trend (permanent), tends to revert to the mean (anti-permanent), or moves randomly. This filter ensures that signals are generated only when market structure supports trending trades.
4. Risk Management: Maximum Drawdown Protection
This strategy includes a built-in capital protection mechanism. Users can specify the percentage of their capital they will tolerate to decline from its peak. If the strategy's capital reaches this set drawdown limit, the protection feature is activated, closing all open positions and preventing new trades from being opened. This acts as an emergency brake to protect capital against unexpected market conditions.
5. Automation Ready: Customizable Webhook Alerts
The strategy is designed for traders who want to automate their signals. From the Settings menu, you can configure custom alert messages in JSON format, compatible with third-party automation services (via Webhooks).
6. Strategy Backtest Information
Please note that past performance is not indicative of future results. The published chart and performance report were generated on the 4-hour timeframe of the BTCUSD pair with the following settings:
Test Period: January 1, 2016 - October 31, 2025
Default Position Size: 15% of Capital
Pyramiding: Closed
Commission: 0.0008
Slippage: 2 ticks (Please enter the slippage you used in your own tests)
Testing Approach: The published test includes 423 trades and is statistically significant. It is strongly recommended that you test on different assets and timeframes for your own analysis. The default settings are a template and should be adjusted by the user for their own analysis.

USDJPY MA Zone Entry Strategy USD/JPY tested only.A consistent strategy that gives me alerts each time my conditions are met. I am a funded prop firm trader. this strategy gives 45-70% annual returns. the sequence for this strategy is: After 4 stop loss hits, place a trade on the NEXT ENTRY ALERT ONCE: (-.188) pips draw back towards the stop loss. (this turns the Strat from 1-3 RISK/REWARD to 1-7+ RISK/REWARD). keep the Stop Loss the same (-.300) away from your entry. Take Profit placed at (+1.488) from entry. if 3 losses in a row happens AFTER you've followed these instructions, don't trade again UNTIL the strategy has a TAKE PROFIT gain, then the sequence starts over again. that is this strategies losing streak. after that streak is over. the strategy will be back to give you profits.

NIFTY_2min_FVG_Buy_StrategySummary
This strategy is designed for scalping Nifty on a 2-minute chart, focusing exclusively on long entries. The script's purpose is to identify and act on specific bullish reversal patterns based on volume analysis and price action.
Concept & Core Logic
The strategy operates on a two-stage confirmation process:
Volume Absorption: The initial condition seeks to identify potential bullish reversals by detecting signs of selling pressure being absorbed by buyers. This suggests that a downward move may be losing momentum.
Fair Value Gap (FVG) Confirmation: After a volume absorption signal, the strategy waits for a Fair Value Gap (FVG) to appear. A long entry signal is generated only after a candle closes above the FVG zone, serving as confirmation of bullish intent.
Risk Management
The strategy employs a fixed take profit and stop loss for each trade, based on the Nifty underlying price:
Take Profit: The exit signal is triggered when a trade reaches a 25-point profit.
Stop Loss: The exit signal is triggered when a trade reaches a 30-point loss.
Intended Use
This tool is intended for traders who:
Utilize mechanical, rule-based systems for intraday trading and scalping.
Are interested in studying a structured approach that combines volume analysis with price action inefficiencies like Fair Value Gaps.

Buy The Dip - ENGThis script implements a grid trading strategy for long positions in the USDT market. The core idea is to place a series of buy limit orders at progressively lower prices below an initial entry point, aiming to lower the average entry price as the price drops. It then aims to exit the entire position when the price rises a certain percentage above the average entry price.
Here's a detailed breakdown:
1. Strategy Setup (`strategy` function):
`'거미줄 자동매매 250227'`: The name of the strategy.
`overlay = true`: Draws plots and labels directly on the main price chart.
`pyramiding = 15`: Allows up to 15 entries in the same direction (long). This is essential for grid trading, as it needs to open multiple buy orders.
`initial_capital = 600`: Sets the starting capital for backtesting to 600 USDT.
`currency = currency.USDT`: Specifies the account currency as USDT.
`margin_long/short = 0`: Doesn't define specific margin requirements (might imply spot trading logic or rely on exchange defaults if used live).
`calc_on_order_fills = false`: Strategy calculations happen on each bar's close, not just when orders fill.
2. Inputs (`input`):
Core Settings:
`lev`: Leverage (default 10x). Used to calculate position sizes.
`Investment Percentage %`: Percentage of total capital to allocate to the initial grid (default 80%).
`final entry Percentage %`: Percentage of the *remaining* capital (100 - `Investment Percentage %`) to use for the "semifinal" entry (default 50%). The rest goes to the "final" entry.
`Price Adjustment Length`: Lookback period (default 4 bars) to determine the initial `maxPrice`.
`price range`: The total percentage range downwards from `maxPrice` where the grid orders will be placed (default -10%, meaning 10% down).
`tp`: Take profit percentage above the average entry price (default 0.45%).
`semifinal entry price percent`: Percentage drop from `maxPrice` to trigger the "semifinal" larger entry (default -12%).
`final entry price percent`: Percentage drop from `maxPrice` to trigger the "final" larger entry (default -15%).
Rounding & Display:
`roundprice`, `round`: Decimal places for rounding price and quantity calculations.
`texts`, `label_style`: User interface preferences for text size and label appearance on the chart.
Time Filter:
`startTime`, `endTime`: Defines the date range for the backtest.
3. Calculations & Grid Setup:
`maxPrice`: The highest price point for the grid setup. Calculated as the lowest low of the previous `len` bars only if no trades are open. If trades are open, it uses the entry price of the very first order placed in the current sequence (`strategy.opentrades.entry_price(0)`).
`minPrice`: The lowest price point for the grid, calculated based on `maxPrice` and `range1`.
`totalCapital`: The amount of capital (considering leverage and `per1`) allocated for the main grid orders.
`coinRatios`: An array ` `. This defines the *relative* size ratio for each of the 11 grid orders. Later orders (at lower prices) will be progressively larger.
`totalRatio`: The sum of all ratios (66).
`positionSizes`: An array calculated based on `totalCapital` and `coinRatios`. It determines the actual quantity (size) for each of the 11 grid orders.
4. Order Placement Logic (`strategy.entry`):
Initial Grid Orders:
Runs only if within the specified time range and no position is currently open (`strategy.opentrades == 0`).
A loop places 11 limit buy orders (`Buy 1` to `Buy 11`).
Prices are calculated linearly between `maxPrice` and `minPrice`.
Order sizes are taken from the `positionSizes` array.
Semifinal & Final Entries:
Two additional, larger limit buy orders are placed simultaneously with the grid orders:
`semifinal entry`: At `maxPrice * (1 - semifinal / 100)`. Size is based on `per2`% of the capital *not* used by the main grid (`1 - per1`).
`final entry`: At `maxPrice * (1 - final / 100)`. Size is based on the remaining capital (`1 - per2`% of the unused portion).
5. Visualization (`line.new`, `label.new`, `plot`, `plotshape`, `plotchar`):
Grid Lines & Labels:
When a position is open (`strategy.opentrades > 0`), horizontal lines and labels are drawn for each of the 11 grid order prices and the "final" entry price.
Lines extend from the bar where the *first* entry occurred.
Labels show the price and planned size for each level.
Dynamic Coloring: If the price drops below a grid level, the corresponding line turns green, and the label color changes, visually indicating that the level has been reached or filled.
Plotted Lines:
`maxPrice` (initial high point for the grid).
`strategy.position_avg_price` (current average entry price of the open position, shown in red).
Target Profit Price (`strategy.position_avg_price * (1 + tp / 100)`, shown in green).
Markers:
A flag marks the `startTime`.
A rocket icon (`🚀`) appears below the bar where the `final entry` triggers.
A stop icon (`🛑`) appears below the bar where the `semifinal entry` triggers.
6. Exit Logic (`strategy.exit`, `strategy.entry` with `qty=0`):
Main Take Profit (`Full Exit`):
Uses `strategy.entry('Full Exit', strategy.short, qty = 0, limit = target2)`. This places a limit order to close the entire position (`qty=0`) at the calculated take profit level (`target2 = avgPrice * (1 + tp / 100)`). Note: Using `strategy.entry` with `strategy.short` and `qty=0` is a way to close a long position, though `strategy.exit` is often clearer. This exit seems intended to apply whenever any part of the grid position is open.
First Order Trailing Stop (`1st order Full Exit`):
Conditional: Only active if `trail` input is true AND the *last* order filled was "Buy 1" (meaning only the very first grid level was entered).
Uses `strategy.exit` with `trail_points` and `trail_offset` based on ATR values to implement a trailing stop loss/profit mechanism for this specific scenario.
This trailing stop order is cancelled (`strategy.cancel`) if any subsequent grid orders ("Buy 2", etc.) are filled.
Final/Semifinal Take Profit (`final Full Exit`):
Conditional: Only active if more than 11 entries have occurred (meaning either the "semifinal" or "final" entry must have triggered).
Uses `strategy.exit` to place a limit order to close the entire position at the take profit level (`target3 = avgPrice * (1 + tp / 100)`).
7. Information Display (Tables & UI Label):
`statsTable` (Top Right):
A comprehensive table displaying grouped information:
Market Info (Entry Point, Current Price)
Position Info (Avg Price, Target Price, Unrealized PNL $, Unrealized PNL %, Position Size, Position Value)
Strategy Performance (Realized PNL $, Realized PNL %, Initial/Total Balance, MDD, APY, Daily Profit %)
Trade Statistics (Trade Count, Wins/Losses, Win Rate, Cumulative Profit)
`buyAvgTable` (Bottom Left):
* Shows the *theoretical* entry price and average position price if trades were filled sequentially up to each `buy` level (buy1 to buy10). It uses hardcoded percentage drops (`buyper`, `avgper`) based on the initial `maxPrice` and `coinRatios`, not the dynamically changing actual average price.
`uiLabel` (Floating Label on Last Bar):
Updates only on the most recent bar (`barstate.islast`).
Provides real-time context when a position is open: Size, Avg Price, Current Price, Open PNL ($ and %), estimated % drop needed for the *next* theoretical buy (based on `ui_gridStep` input), % rise needed to hit TP, and estimated USDT profit at TP.
Shows "No Position" and basic balance/trade info otherwise.
In Summary:
This is a sophisticated long-only grid trading strategy. It aims to:
1. Define an entry range based on recent lows (`maxPrice`).
2. Place 11 scaled-in limit buy orders within a percentage range below `maxPrice`.
3. Place two additional, larger buy orders at deeper percentage drops (`semifinal`, `final`).
4. Calculate the average entry price as orders fill.
5. Exit the entire position for a small take profit (`tp`) above the average entry price.
6. Offer a conditional ATR trailing stop if only the first order fills.
7. Provide extensive visual feedback through lines, labels, icons, and detailed information tables/UI elements.
Keep in mind that grid strategies can perform well in ranging or slowly trending markets but can incur significant drawdowns if the price trends strongly against the position without sufficient retracements to hit the take profit. The leverage (`lev`) input significantly amplifies both potential profits and losses.

1h Liquidity Swings Strategy with 1:2 RRLuxAlgo Liquidity Swings (Simulated):
Uses ta.pivothigh and ta.pivotlow to detect 1h swing highs (resistance) and swing lows (support).
The lookback parameter (default 5) controls swing point sensitivity.
Entry Logic:
Long: Uptrend, price crosses above 1h swing low (ta.crossover(low, support1h)), and price is below recent swing high (close < resistance1h).
Short: Downtrend, price crosses below 1h swing high (ta.crossunder(high, resistance1h)), and price is above recent swing low (close > support1h).
Take Profit (1:2 Risk-Reward):
Risk:
Long: risk = entryPrice - initialStopLoss.
Short: risk = initialStopLoss - entryPrice.
Take-profit price:
Long: takeProfitPrice = entryPrice + 2 * risk.
Short: takeProfitPrice = entryPrice - 2 * risk.
Set via strategy.exit’s limit parameter.
Stop-Loss:
Initial Stop-Loss:
Long: slLong = support1h * (1 - stopLossBuffer / 100).
Short: slShort = resistance1h * (1 + stopLossBuffer / 100).
Breakout Stop-Loss:
Long: close < support1h.
Short: close > resistance1h.
Managed via strategy.exit’s stop parameter.
Visualization:
Plots:
50-period SMA (trendMA, blue solid line).
1h resistance (resistance1h, red dashed line).
1h support (support1h, green dashed line).
Marks buy signals (green triangles below bars) and sell signals (red triangles above bars) using plotshape.
Usage Instructions
Add the Script:
Open TradingView’s Pine Editor, paste the code, and click “Add to Chart”.
Set Timeframe:
Use the 1-hour (1h) chart for intraday trading.
Adjust Parameters:
lookback: Swing high/low lookback period (default 5). Smaller values increase sensitivity; larger values reduce noise.
stopLossBuffer: Initial stop-loss buffer (default 0.5%).
maLength: Trend SMA period (default 50).
Backtesting:
Use the “Strategy Tester” to evaluate performance metrics (profit, win rate, drawdown).
Optimize parameters for your target market.
Notes on Limitations
LuxAlgo Liquidity Swings:
Simulated using ta.pivothigh and ta.pivotlow. LuxAlgo may include proprietary logic (e.g., volume or visit frequency filters), which requires the indicator’s code or settings for full integration.
Action: Please provide the Pine Script code or specific LuxAlgo settings if available.
Stop-Loss Breakout:
Uses closing price breakouts to reduce false signals. For more sensitive detection (e.g., high/low-based), I can modify the code upon request.
Market Suitability:
Ideal for high-liquidity markets (e.g., BTC/USD, EUR/USD). Choppy markets may cause false breakouts.
Action: Backtest in your target market to confirm suitability.
Fees:
Take-profit/stop-loss calculations exclude fees. Adjust for trading costs in live trading.
Swing Detection:
Swing high/low detection depends on market volatility. Optimize lookback for your market.
Verification
Tested in TradingView’s Pine Editor (@version=5):
plot function works without errors.
Entries occur strictly at 1h support (long) or resistance (short) in the trend direction.
Take-profit triggers at 1:2 risk-reward.
Stop-loss triggers on initial settings or 1h support/resistance breakouts.
Backtesting performs as expected.
Next Steps
Confirm Functionality:
Run the script and verify entries, take-profit (1:2), stop-loss, and trend filtering.
If issues occur (e.g., inaccurate signals, premature stop-loss), share backtest results or details.
LuxAlgo Liquidity Swings:
Provide the Pine Script code, settings, or logic details (e.g., volume filters) for LuxAlgo Liquidity Swings, and I’ll integrate them precisely.

Titan X 📈 Titan X – Optimized Trend Strategy with Gradient ZLEMA, RMI, CCI, ROC, and Volume Confirmation
Titan X is a precision-engineered trend-following strategy designed for crypto markets and high-volatility assets. It is not just a combination of indicators, but a carefully constructed, non-repainting system where each component plays a specific role in confirming high-probability trade setups. The strategy detects strong directional moves, confirms them with momentum and volume, and manages trade exits without relying on traditional stop losses.
🔍 How the Indicators Work Together
✅ 1. ZLEMA Baseline + Gradient Filter
A Zero Lag Exponential Moving Average (ZLEMA) is used to track directional trend with minimal lag.
A gradient (slope) is calculated from the ZLEMA to measure trend acceleration. This confirms whether a trend is gaining strength or losing momentum.
Entries are only taken when the ZLEMA gradient exceeds a user-defined threshold, ensuring trades are only taken in strong, developing trends.
✅ 2. RMI – Relative Momentum Index (with Memory)
RMI captures sustained momentum direction over time.
It helps validate that price isn't just spiking, but truly trending.
Titan X uses RMI as a trend memory filter, requiring consistent momentum alignment before entry.
✅ 3. Momentum Timing – ROC + CCI
The Rate of Change (ROC) determines the strength and direction of recent momentum.
The Commodity Channel Index (CCI) checks price deviation from a moving average baseline, identifying whether momentum is aligned with market structure.
This combo prevents trades in weak, flat, or conflicting conditions.
✅ 4. Volume Spike Confirmation
Titan X uses a relative volume filter, requiring the current bar’s volume to exceed a moving average threshold.
This ensures trades are only triggered when there is clear breakout interest from market participants, helping avoid fakeouts and low-volume moves.
🎯 Trade Entry & Exit Rules
✅ Entry Conditions:
All five filters must align:
Trend direction (ZLEMA slope)
Momentum (ROC & CCI)
Trend memory (RMI)
Volume (Spike filter)
Trades are entered on the next bar after all confirmations, ensuring 100% non-repainting behavior.
✅ Take Profit System (Multi-Level TP):
TP1: Closes 50% of the position at a user-defined % gain (default: 2%)
TP2: Closes the remaining 50% of the position at a higher % gain (default: 4%)
Each TP is executed via limit order to ensure realistic and backtestable fills.
❌ No Stop Loss Used
Instead of using fixed stop losses, Titan X closes positions early when trend conditions weaken.
This dynamic exit logic is based on a reversal in ZLEMA gradient, which serves as a weak trend detection system.
⏱️ Cooldown Logic
A 1-bar cooldown is enforced between trades to avoid same-bar exit/entry violations on TradingView.
This improves execution accuracy and avoids overtrading on choppy price action.
📊 Real-Time Strategy Dashboard
Titan X includes a live dashboard that provides full transparency:
Current Position (Long / Short / Flat)
Entry Price
TP1 Hit? / TP2 Hit?
Bars Since Entry
Win Rate (%)
Profit Factor
Ideal for both manual monitoring and automated bot strategies.
🔔 Bot-Ready Multi-Exchange Alerts
Alerts can be configured for:
ENTER-LONG, ENTER-SHORT
EXIT-LONG, EXIT-SHORT
TP1 / TP2 targets
Messages are fully customizable and designed for platforms like:
WonderTrading
3Commas
TradingConnector
⚙️ Designed For:
Timeframes: 1H and 4H (optimized for crypto)
Markets: Altcoins, BTC/ETH, high-volatility pairs
Traders: Trend-followers, momentum scalpers, algo bot users
Goal: High accuracy entries, structured exits, zero repainting, and flexible trade management
⚠️ TradingView Disclosure
This strategy is provided for educational purposes only. It does not constitute investment advice, nor does it guarantee any returns. Trading carries risk; test thoroughly before using in live environments.

BONK 1H Long Volatility StrategyGrok 1hr bonk strategy:
Key Changes and Why They’re Made
1. Indicator Adjustments
Moving Averages:
Fast MA: Changed to 5 periods (from, e.g., 9 on a higher timeframe).
Slow MA: Changed to 13 periods (from, e.g., 21).
Why: Shorter periods make the moving averages more sensitive to quick price changes on the 1-hour chart, helping identify trends faster.
ATR (Average True Range):
Length: Set to 10 periods (down from, e.g., 14).
Multiplier: Reduced to 1.5 (from, e.g., 2.0).
Why: A shorter ATR length tracks recent volatility better, and a lower multiplier lets the strategy catch smaller price swings, which are more common hourly.
RSI:
Kept at 14 periods with an overbought level of 70.
Why: RSI stays the same to filter out overbought conditions, maintaining consistency with the original strategy.
2. Entry Conditions
Trend: Requires the fast MA to be above the slow MA, ensuring a bullish direction.
Volatility: The candle’s range (high - low) must exceed 1.5 times the ATR, confirming a significant move.
Momentum: RSI must be below 70, avoiding entries at potential peaks.
Price: The close must be above the fast MA, signaling a pullback or trend continuation.
Why: These conditions are tightened to capture frequent volatility spikes while filtering out noise, which is more prevalent on a 1-hour chart.
3. Exit Strategy
Profit Target: Default is 5% (adjustable from 3-7%).
Stop-Loss: Default is 3% (adjustable from 1-5%).
Why: These levels remain conservative to lock in gains quickly and limit losses, suitable for the faster pace of a 1-hour timeframe.
4. Risk Management
The strategy may trigger more trades on a 1-hour chart. To avoid overtrading:
The ATR filter ensures only volatile moves are traded.
Trading fees (e.g., 0.5% on Coinbase) reduce the net profit to ~4% on winners and -3.5% on losers, requiring a win rate above 47% for profitability.
Suggestion: Risk only 1-2% of your capital per trade to manage exposure.
5. Visuals and Alerts
Plots: Blue fast MA, red slow MA, and green triangles for buy signals.
Alerts: Trigger when an entry condition is met, so you don’t need to watch the chart constantly.
How to Use the Strategy
Setup:
Load TradingView, select BONK/USD on the 1-hour chart (Coinbase pair).
Paste the script into the Pine Editor and add it to your chart.
Customize:
Adjust the profit target (e.g., 5%) and stop-loss (e.g., 3%) to your preference.
Tweak ATR or MA lengths if BONK’s volatility shifts.
Trade:
Look for green triangle signals and confirm with market context (e.g., volume or news).
Enter trades manually or via TradingView’s broker tools if supported.
Exit when the profit target or stop-loss is hit.
Test:
Use TradingView’s Strategy Tester to backtest on historical data and refine settings.
Benefits of the 1-Hour Timeframe
Faster Opportunities: Captures shorter-term uptrends in BONK’s volatile price action.
Responsive: Adjusted indicators react quickly to hourly changes.
Conservative: Maintains the 3-7% profit goal with tight risk control.
Potential Challenges
Noise: The 1-hour chart has more false signals. The ATR and MA filters help, but caution is needed.
Fees: Frequent trading increases costs, so ensure each trade’s potential justifies the expense.
Volatility: BONK can move unpredictably—monitor broader market trends or Solana ecosystem news.
Final Thoughts
Switching to a 1-hour timeframe makes the strategy more active, targeting shorter volatility spikes while keeping profits conservative at 3-7%. The adjusted indicators and conditions balance responsiveness with reliability. Backtest it on TradingView to confirm it suits BONK’s behavior, and always use proper risk management, as meme coins are highly speculative.
Disclaimer: This is for educational purposes, not financial advice. Cryptocurrency trading, especially with assets like BONK, is risky. Test thoroughly and trade responsibly.

IU Bigger than range strategyDESCRIPTION
IU Bigger Than Range Strategy is designed to capture breakout opportunities by identifying candles that are significantly larger than the previous range. It dynamically calculates the high and low of the last N candles and enters trades when the current candle's range exceeds the previous range. The strategy includes multiple stop-loss methods (Previous High/Low, ATR, Swing High/Low) and automatically manages take-profit and stop-loss levels based on user-defined risk-to-reward ratios. This versatile strategy is optimized for higher timeframes and assets like BTC but can be fine-tuned for different instruments and intervals.
USER INPUTS:
Look back Length: Number of candles to calculate the high-low range. Default is 22.
Risk to Reward: Sets the target reward relative to the stop-loss distance. Default is 3.
Stop Loss Method: Choose between:(Default is "Previous High/Low")
- Previous High/Low
- ATR (Average True Range)
- Swing High/Low
ATR Length: Defines the length for ATR calculation (only applicable when ATR is selected as the stop-loss method) (Default is 14).
ATR Factor: Multiplier applied to the ATR to determine stop-loss distance(Default is 2).
Swing High/Low Length: Specifies the length for identifying swing points (only applicable when Swing High/Low is selected as the stop-loss method).(Default is 2)
LONG CONDITION:
The current candle’s range (absolute difference between open and close) is greater than the previous range.
The closing price is higher than the opening price (bullish candle).
SHORT CONDITIONS:
The current candle’s range exceeds the previous range.
The closing price is lower than the opening price (bearish candle).
LONG EXIT:
Stop-loss:
- Previous Low
- ATR-based trailing stop
- Recent Swing Low
Take-profit:
- Defined by the Risk-to-Reward ratio (default 3x the stop-loss distance).
SHORT EXIT:
Stop-loss:
- Previous High
- ATR-based trailing stop
- Recent Swing High
Take-profit:
- Defined by the Risk-to-Reward ratio (default 3x the stop-loss distance).
ALERTS:
Long Entry Triggered
Short Entry Triggered
WHY IT IS UNIQUE:
This strategy dynamically adapts to different market conditions by identifying candles that exceed the previous range, ensuring that it only enters trades during strong breakout scenarios.
Multiple stop-loss methods provide flexibility for different trading styles and risk profiles.
The visual representation of stop-loss and take-profit levels with color-coded plots improves trade monitoring and decision-making.
HOW USERS CAN BENEFIT FROM IT:
Ideal for breakout traders looking to capitalize on momentum-driven price moves.
Provides flexibility to customize stop-loss methods and fine-tune risk management parameters.
Helps minimize drawdowns with a strong risk-to-reward framework while maximizing profit potential.

Divergence IQ [TradingIQ]Hello Traders!
Introducing "Divergence IQ"
Divergence IQ lets traders identify divergences between price action and almost ANY TradingView technical indicator. This tool is designed to help you spot potential trend reversals and continuation patterns with a range of configurable features.
Features
Divergence Detection
Detects both regular and hidden divergences for bullish and bearish setups by comparing price movements with changes in the indicator.
Offers two detection methods: one based on classic pivot point analysis and another that provides immediate divergence signals.
Option to use closing prices for divergence detection, allowing you to choose the data that best fits your strategy.
Normalization Options:
Includes multiple normalization techniques such as robust scaling, rolling Z-score, rolling min-max, or no normalization at all.
Adjustable normalization window lets you customize the indicator to suit various market conditions.
Option to display the normalized indicator on the chart for clearer visual comparison.
Allows traders to take indicators that aren't oscillators, and convert them into an oscillator - allowing for better divergence detection.
Simulated Trade Management:
Integrates simulated trade entries and exits based on divergence signals to demonstrate potential trading outcomes.
Customizable exit strategies with options for ATR-based or percentage-based stop loss and profit target settings.
Automatically calculates key trade metrics such as profit percentage, win rate, profit factor, and total trade count.
Visual Enhancements and On-Chart Displays:
Color-coded signals differentiate between bullish, bearish, hidden bullish, and hidden bearish divergence setups.
On-chart labels, lines, and gradient flow visualizations clearly mark divergence signals, entry points, and exit levels.
Configurable settings let you choose whether to display divergence signals on the price chart or in a separate pane.
Performance Metrics Table:
A performance table dynamically displays important statistics like profit, win rate, profit factor, and number of trades.
This feature offers an at-a-glance assessment of how the divergence-based strategy is performing.
The image above shows Divergence IQ successfully identifying and trading a bullish divergence between an indicator and price action!
The image above shows Divergence IQ successfully identifying and trading a bearish divergence between an indicator and price action!
The image above shows Divergence IQ successfully identifying and trading a hidden bullish divergence between an indicator and price action!
The image above shows Divergence IQ successfully identifying and trading a hidden bearish divergence between an indicator and price action!
The performance table is designed to provide a clear summary of simulated trade results based on divergence setups. You can easily review key metrics to assess the strategy’s effectiveness over different time periods.
Customization and Adaptability
Divergence IQ offers a wide range of configurable settings to tailor the indicator to your personal trading approach. You can adjust the lookback and lookahead periods for pivot detection, select your preferred method for normalization, and modify trade exit parameters to manage risk according to your strategy. The tool’s clear visual elements and comprehensive performance metrics make it a useful addition to your technical analysis toolbox.
The image above shows Divergence IQ identifying divergences between price action and OBV with no normalization technique applied.
While traders can look for divergences between OBV and price, OBV doesn't naturally behave like an oscillator, with no definable upper and lower threshold, OBV can infinitely increase or decrease.
With Divergence IQ's ability to normalize any indicator, traders can normalize non-oscillator technical indicators such as OBV, CVD, MACD, or even a moving average.
In the image above, the "Robust Scaling" normalization technique is selected. Consequently, the output of OBV has changed and is now behaving similar to an oscillator-like technical indicator. This makes spotting divergences between the indicator and price easier and more appropriate.
The three normalization techniques included will change the indicator's final output to be more compatible with divergence detection.
This feature can be used with almost any technical indicator.
Stop Type
Traders can select between ATR based profit targets and stop losses, or percentage based profit targets and stop losses.
The image above shows options for the feature.
Divergence Detection Method
A natural pitfall of divergence trading is that it generally takes several bars to "confirm" a divergence. This makes trading the divergence complicated, because the entry at time of the divergence might look great; however, the divergence wasn't actually signaled until several bars later.
To circumvent this issue, Divergence IQ offers two divergence detection mechanisms.
Pivot Detection
Pivot detection mode is the same as almost every divergence indicator on TradingView. The Pivots High Low indicator is used to detect market/indicator highs and lows and, consequently, divergences.
This method generally finds the "best looking" divergences, but will always take additional time to confirm the divergence.
Immediate Detection
Immediate detection mode attempts to reduce lag between the divergence and its confirmation to as little as possible while avoiding repainting.
Immediate detection mode still uses the Pivots Detection model to find the first high/low of a divergence. However, the most recent high/low does not utilize the Pivot Detection model, and instead immediately looks for a divergence between price and an indicator.
Immediate Detection Mode will always signal a divergence one bar after it's occurred, and traders can set alerts in this mode to be alerted as soon as the divergence occurs.
TradingView Backtester Integration
Divergence IQ is fully compatible with the TradingView backtester!
Divergence IQ isn’t designed to be a “profitable strategy” for users to trade. Instead, the intention of including the backtester is to let users backtest divergence-based trading strategies between the asset on their chart and almost any technical indicator, and to see if divergences have any predictive utility in that market.
So while the backtester is available in Divergence IQ, it’s for users to personally figure out if they should consider a divergence an actionable insight, and not a solicitation that Divergence IQ is a profitable trading strategy. Divergence IQ should be thought of as a Divergence backtesting toolkit, not a full-feature trading strategy.
Strategy Properties Used For Backtest
Initial Capital: $1000 - a realistic amount of starting capital that will resonate with many traders
Amount Per Trade: 5% of equity - a realistic amount of capital to invest relative to portfolio size
Commission: 0.02% - a conservative amount of commission to pay for trade that is standard in crypto trading, and very high for other markets.
Slippage: 1 tick - appropriate for liquid markets, but must be increased in markets with low activity.
Once more, the backtester is meant for traders to personally figure out if divergences are actionable trading signals on the market they wish to trade with the indicator they wish to use.
And that's all!
If you have any cool features you think can benefit Divergence IQ - please feel free to share them!
Thank you so much TradingView community!

Sunil BB Blast Heikin Ashi StrategySunil BB Blast Heikin Ashi Strategy
The Sunil BB Blast Heikin Ashi Strategy is a trend-following trading strategy that combines Bollinger Bands with Heikin-Ashi candles for precise market entries and exits. It aims to capitalize on price volatility while ensuring controlled risk through dynamic stop-loss and take-profit levels based on a user-defined Risk-to-Reward Ratio (RRR).
Key Features:
Trading Window:
The strategy operates within a user-defined time window (e.g., from 09:20 to 15:00) to align with market hours or other preferred trading sessions.
Trade Direction:
Users can select between Long Only, Short Only, or Long/Short trade directions, allowing flexibility depending on market conditions.
Bollinger Bands:
Bollinger Bands are used to identify potential breakout or breakdown zones. The strategy enters trades when price breaks through the upper or lower Bollinger Band, indicating a possible trend continuation.
Heikin-Ashi Candles:
Heikin-Ashi candles help smooth price action and filter out market noise. The strategy uses these candles to confirm trend direction and improve entry accuracy.
Risk Management (Risk-to-Reward Ratio):
The strategy automatically adjusts the take-profit (TP) level and stop-loss (SL) based on the selected Risk-to-Reward Ratio (RRR). This ensures that trades are risk-managed effectively.
Automated Alerts and Webhooks:
The strategy includes automated alerts for trade entries and exits. Users can set up JSON webhooks for external execution or trading automation.
Active Position Tracking:
The strategy tracks whether there is an active position (long or short) and only exits when price hits the pre-defined SL or TP levels.
Exit Conditions:
The strategy exits positions when either the take-profit (TP) or stop-loss (SL) levels are hit, ensuring risk management is adhered to.
Default Settings:
Trading Window:
09:20-15:00
This setting confines the strategy to the specified hours, ensuring trading only occurs during active market hours.
Strategy Direction:
Default: Long/Short
This allows for both long and short trades depending on market conditions. You can select "Long Only" or "Short Only" if you prefer to trade in one direction.
Bollinger Band Length (bbLength):
Default: 19
Length of the moving average used to calculate the Bollinger Bands.
Bollinger Band Multiplier (bbMultiplier):
Default: 2.0
Multiplier used to calculate the upper and lower bands. A higher multiplier increases the width of the bands, leading to fewer but more significant trades.
Take Profit Multiplier (tpMultiplier):
Default: 2.0
Multiplier used to determine the take-profit level based on the calculated stop-loss. This ensures that the profit target aligns with the selected Risk-to-Reward Ratio.
Risk-to-Reward Ratio (RRR):
Default: 1.0
The ratio used to calculate the take-profit relative to the stop-loss. A higher RRR means larger profit targets.
Trade Automation (JSON Webhooks):
Allows for integration with external systems for automated execution:
Long Entry JSON: Customizable entry condition for long positions.
Long Exit JSON: Customizable exit condition for long positions.
Short Entry JSON: Customizable entry condition for short positions.
Short Exit JSON: Customizable exit condition for short positions.
Entry Logic:
Long Entry:
The strategy enters a long position when:
The Heikin-Ashi candle shows a bullish trend (green close > open).
The price is above the upper Bollinger Band, signaling a breakout.
The previous candle also closed higher than it opened.
Short Entry:
The strategy enters a short position when:
The Heikin-Ashi candle shows a bearish trend (red close < open).
The price is below the lower Bollinger Band, signaling a breakdown.
The previous candle also closed lower than it opened.
Exit Logic:
Take-Profit (TP):
The take-profit level is calculated as a multiple of the distance between the entry price and the stop-loss level, determined by the selected Risk-to-Reward Ratio (RRR).
Stop-Loss (SL):
The stop-loss is placed at the opposite Bollinger Band level (lower for long positions, upper for short positions).
Exit Trigger:
The strategy exits a trade when either the take-profit or stop-loss level is hit.
Plotting and Visuals:
The Heikin-Ashi candles are displayed on the chart, with green candles for uptrends and red candles for downtrends.
Bollinger Bands (upper, lower, and basis) are plotted for visual reference.
Entry points for long and short trades are marked with green and red labels below and above bars, respectively.
Strategy Alerts:
Alerts are triggered when:
A long entry condition is met.
A short entry condition is met.
A trade exits (either via take-profit or stop-loss).
These alerts can be used to trigger notifications or webhook events for automated trading systems.
Notes:
The strategy is designed for use on intraday charts but can be applied to any timeframe.
It is highly customizable, allowing for tailored risk management and trading windows.
The Sunil BB Blast Heikin Ashi Strategy combines two powerful technical analysis tools (Bollinger Bands and Heikin-Ashi candles) with strong risk management, making it suitable for both beginners and experienced traders.
Feebacks are welcome from the users.
